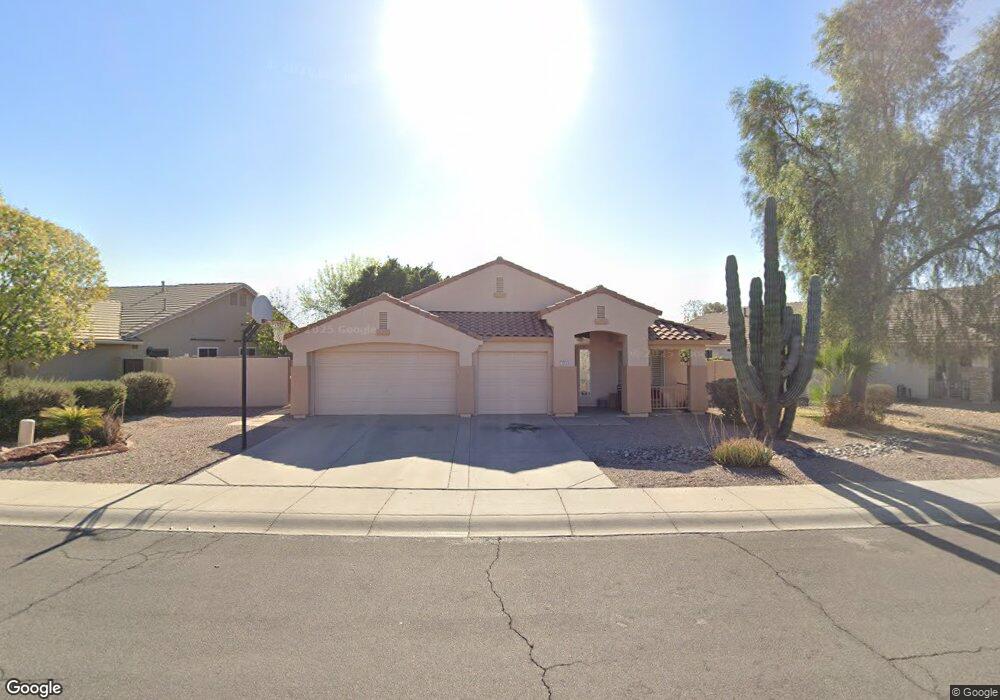
933 N John Way Chandler, AZ 85225
East Chandler NeighborhoodEstimated Value: $584,040 - $659,000
4
Beds
2
Baths
2,136
Sq Ft
$295/Sq Ft
Est. Value
About This Home
This home is located at 933 N John Way, Chandler, AZ 85225 and is currently estimated at $630,260, approximately $295 per square foot. 933 N John Way is a home located in Maricopa County with nearby schools including Sanborn Elementary School, Willis Junior High School, and Chandler High School.
Ownership History
Date
Name
Owned For
Owner Type
Purchase Details
Closed on
Oct 8, 2009
Sold by
Benson Donald F and Benson Phyllis A
Bought by
Hammond Darrel W and Hammond Roberta R
Current Estimated Value
Home Financials for this Owner
Home Financials are based on the most recent Mortgage that was taken out on this home.
Original Mortgage
$240,562
Outstanding Balance
$156,601
Interest Rate
5.02%
Mortgage Type
FHA
Estimated Equity
$473,659
Purchase Details
Closed on
Aug 5, 1998
Sold by
Fulton Homes Sales Corp
Bought by
Benson Donald F and Benson Phyllis A
Home Financials for this Owner
Home Financials are based on the most recent Mortgage that was taken out on this home.
Original Mortgage
$123,250
Interest Rate
6.93%
Mortgage Type
New Conventional
Create a Home Valuation Report for This Property
The Home Valuation Report is an in-depth analysis detailing your home's value as well as a comparison with similar homes in the area
Home Values in the Area
Average Home Value in this Area
Purchase History
| Date | Buyer | Sale Price | Title Company |
|---|---|---|---|
| Hammond Darrel W | $245,000 | Chicago Title | |
| Benson Donald F | $146,901 | Security Title Agency | |
| Fulton Homes Sales Corp | $146,901 | Security Title Agency |
Source: Public Records
Mortgage History
| Date | Status | Borrower | Loan Amount |
|---|---|---|---|
| Open | Hammond Darrel W | $240,562 | |
| Previous Owner | Benson Donald F | $123,250 |
Source: Public Records
Tax History Compared to Growth
Tax History
| Year | Tax Paid | Tax Assessment Tax Assessment Total Assessment is a certain percentage of the fair market value that is determined by local assessors to be the total taxable value of land and additions on the property. | Land | Improvement |
|---|---|---|---|---|
| 2025 | $2,203 | $28,277 | -- | -- |
| 2024 | $2,127 | $26,931 | -- | -- |
| 2023 | $2,127 | $42,720 | $8,540 | $34,180 |
| 2022 | $2,053 | $32,460 | $6,490 | $25,970 |
| 2021 | $2,152 | $30,520 | $6,100 | $24,420 |
| 2020 | $2,142 | $28,580 | $5,710 | $22,870 |
| 2019 | $2,060 | $26,430 | $5,280 | $21,150 |
| 2018 | $1,995 | $25,960 | $5,190 | $20,770 |
| 2017 | $1,859 | $24,300 | $4,860 | $19,440 |
| 2016 | $1,791 | $23,680 | $4,730 | $18,950 |
| 2015 | $1,736 | $21,610 | $4,320 | $17,290 |
Source: Public Records
Map
Nearby Homes
- 1691 E Gary Dr
- 1853 E Shannon St
- 791 N Velero St
- 941 N Adams Ct
- 1590 E Robinson Way
- 1126 N Melody Cir
- 1818 S Saddle St
- 741 N Soho Place
- 1951 E Baylor Ct
- 745 W Ivanhoe St
- 642 N Danyell Ct
- 938 W Iris Dr
- 1302 N Bedford Dr
- 420 N Leoma Ln
- 1214 W Iris Dr
- 1014 E Golden Ct
- 861 W Shellfish Dr
- 860 N Mcqueen Rd Unit 1163
- 2403 E San Tan St
- 643 W Devon Ct
- 953 N John Way
- 902 N Marion Way
- 963 N John Way
- 893 N John Way
- 892 N Marion Way
- 942 N John Way
- 912 N Marion Way
- 932 N John Way
- 952 N John Way
- 973 N John Way
- 922 N John Way
- 883 N John Way
- 962 N John Way
- 922 N Marion Way
- 912 N John Way
- 882 N Marion Way
- 902 N John Way
- 972 N John Way
- 983 N John Way
- 892 N John Way