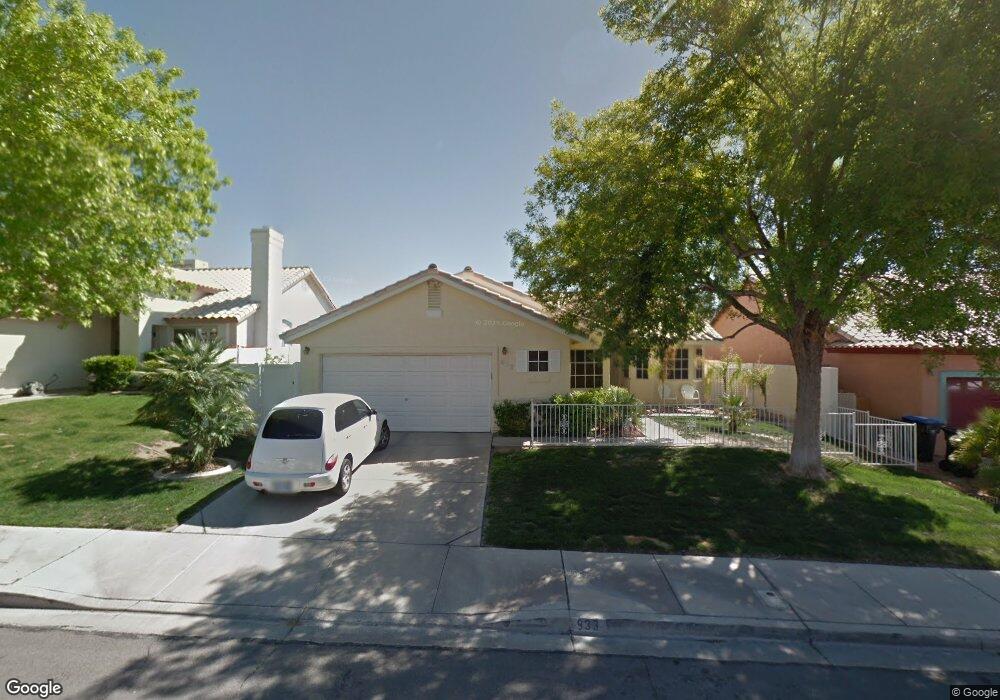
933 Shadowfax Rd Henderson, NV 89015
Foothills NeighborhoodEstimated Value: $440,000 - $454,000
3
Beds
2
Baths
1,645
Sq Ft
$272/Sq Ft
Est. Value
About This Home
This home is located at 933 Shadowfax Rd, Henderson, NV 89015 and is currently estimated at $447,193, approximately $271 per square foot. 933 Shadowfax Rd is a home located in Clark County with nearby schools including Sue H. Morrow Elementary School, B Mahlon Brown Academy of International Studies, and Basic Academy of International Studies.
Ownership History
Date
Name
Owned For
Owner Type
Purchase Details
Closed on
Jan 2, 2020
Sold by
Almberg Michael David and Almberg Susan Marie
Bought by
Bloomer Patricia and Bloomer Raymond W
Current Estimated Value
Home Financials for this Owner
Home Financials are based on the most recent Mortgage that was taken out on this home.
Original Mortgage
$244,800
Outstanding Balance
$214,426
Interest Rate
3.6%
Mortgage Type
New Conventional
Estimated Equity
$232,767
Purchase Details
Closed on
Feb 25, 2014
Sold by
Ryder Owen J and Ryder Phyllis A
Bought by
Almberg Michael David and Almberg Susan Marie
Home Financials for this Owner
Home Financials are based on the most recent Mortgage that was taken out on this home.
Original Mortgage
$110,000
Interest Rate
4.38%
Mortgage Type
New Conventional
Purchase Details
Closed on
Feb 10, 2011
Sold by
Fannie Mae
Bought by
Ryder Owen J and Ryder Phyllis A
Home Financials for this Owner
Home Financials are based on the most recent Mortgage that was taken out on this home.
Original Mortgage
$107,120
Interest Rate
4.84%
Mortgage Type
New Conventional
Purchase Details
Closed on
Nov 30, 2010
Sold by
Oaks Stephanie
Bought by
Federal National Mortgage Association
Purchase Details
Closed on
Dec 27, 2007
Sold by
Lucas Anthony and Lucas Dena
Bought by
Oaks Stephanie
Home Financials for this Owner
Home Financials are based on the most recent Mortgage that was taken out on this home.
Original Mortgage
$284,999
Interest Rate
6.09%
Mortgage Type
Unknown
Purchase Details
Closed on
Mar 31, 2005
Sold by
Marshall Janet C
Bought by
Lucas Anthony and Lucas Dena
Home Financials for this Owner
Home Financials are based on the most recent Mortgage that was taken out on this home.
Original Mortgage
$225,000
Interest Rate
5.6%
Mortgage Type
Unknown
Purchase Details
Closed on
Jun 21, 2004
Sold by
Madnick Jan and Madnick Beverly J
Bought by
Marshall Janet C
Home Financials for this Owner
Home Financials are based on the most recent Mortgage that was taken out on this home.
Original Mortgage
$232,000
Interest Rate
5.62%
Mortgage Type
Unknown
Purchase Details
Closed on
Aug 16, 1995
Sold by
Crl Inc
Bought by
Madnick Jan and Madnick Beverly J
Home Financials for this Owner
Home Financials are based on the most recent Mortgage that was taken out on this home.
Original Mortgage
$115,150
Interest Rate
7.71%
Create a Home Valuation Report for This Property
The Home Valuation Report is an in-depth analysis detailing your home's value as well as a comparison with similar homes in the area
Home Values in the Area
Average Home Value in this Area
Purchase History
| Date | Buyer | Sale Price | Title Company |
|---|---|---|---|
| Bloomer Patricia | $306,000 | Ticor Title Henderson | |
| Almberg Michael David | $180,000 | Chicago Title Las Vegas | |
| Ryder Owen J | $133,900 | Lawyers Title Of Nevada Hen | |
| Federal National Mortgage Association | $309,891 | Accommodation | |
| Oaks Stephanie | $299,999 | First American Title Company | |
| Lucas Anthony | $325,000 | First Amer Title Co Of Nv | |
| Marshall Janet C | $290,000 | First American Title Co Of | |
| Madnick Jan | $121,500 | First American Title Co |
Source: Public Records
Mortgage History
| Date | Status | Borrower | Loan Amount |
|---|---|---|---|
| Open | Bloomer Patricia | $244,800 | |
| Previous Owner | Almberg Michael David | $110,000 | |
| Previous Owner | Ryder Owen J | $107,120 | |
| Previous Owner | Oaks Stephanie | $284,999 | |
| Previous Owner | Lucas Anthony | $225,000 | |
| Previous Owner | Marshall Janet C | $232,000 | |
| Previous Owner | Madnick Jan | $115,150 | |
| Closed | Marshall Janet C | $29,000 |
Source: Public Records
Tax History
| Year | Tax Paid | Tax Assessment Tax Assessment Total Assessment is a certain percentage of the fair market value that is determined by local assessors to be the total taxable value of land and additions on the property. | Land | Improvement |
|---|---|---|---|---|
| 2026 | $1,727 | $100,261 | $35,700 | $64,561 |
| 2025 | $1,676 | $97,601 | $31,150 | $66,451 |
| 2024 | $1,628 | $97,601 | $31,150 | $66,451 |
| 2023 | $1,628 | $94,984 | $31,850 | $63,134 |
| 2022 | $1,581 | $86,664 | $28,700 | $57,964 |
| 2021 | $1,535 | $79,667 | $24,500 | $55,167 |
| 2020 | $1,487 | $78,708 | $23,800 | $54,908 |
| 2019 | $1,362 | $74,422 | $20,300 | $54,122 |
| 2018 | $1,299 | $68,396 | $16,100 | $52,296 |
| 2017 | $1,880 | $67,483 | $14,350 | $53,133 |
| 2016 | $1,215 | $61,591 | $8,400 | $53,191 |
| 2015 | $1,287 | $46,278 | $8,400 | $37,878 |
| 2014 | $1,247 | $43,468 | $7,000 | $36,468 |
Source: Public Records
Map
Nearby Homes
- 128 Ringlore Dr
- 163 Spinnaker Dr
- 918 Clipper Dr
- 865 Bussora Rose Dr
- 926 Anchor Dr
- 923 Highland Trails Ave
- 206 Valerian St
- 152 Emden Dr
- 200 Oleander Place
- 826 Anchor Dr
- 329 Blossom Wind St
- 321 Blossom Wind St
- 0 0 Parawan
- 1021 Venice Ave
- 0 Burkholder Unit 2721538
- 328 S Milan St
- 341 Talladega Ct
- 252 Hull St
- 311 S Lisbon St
- 412 Cindy Place
- 935 Shadowfax Rd
- 931 Shadowfax Rd Unit n/a
- 931 Shadowfax Rd
- 932 Longshanks Way
- 108 Ringlore Dr
- 929 Shadowfax Rd
- 101 Skytop Dr
- 103 Skytop Dr
- 932 Shadowfax Rd
- 934 Shadowfax Rd
- 930 Longshanks Way
- 930 Shadowfax Rd
- 936 Shadowfax Rd
- 105 Skytop Dr
- 927 Shadowfax Rd
- 928 Shadowfax Rd
- 110 Ringlore Dr
- 928 Longshanks Way Unit 3
- 938 Shadowfax Rd
- 107 Skytop Dr
Your Personal Tour Guide
Ask me questions while you tour the home.