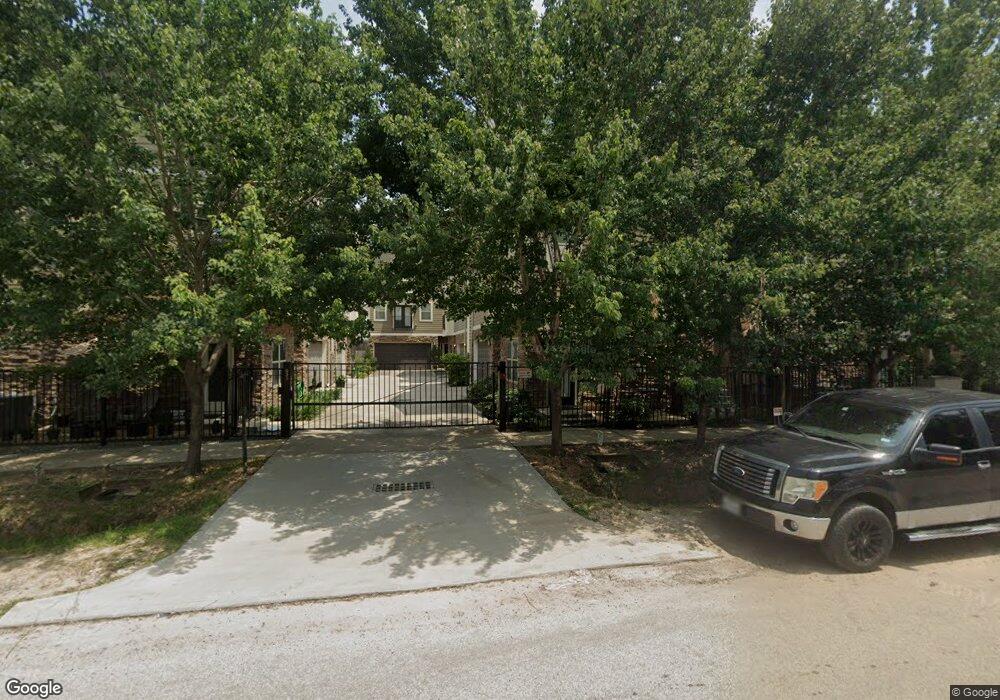
933 W 24th St Unit E Houston, TX 77008
Greater Heights NeighborhoodEstimated Value: $471,606 - $517,000
3
Beds
4
Baths
2,202
Sq Ft
$221/Sq Ft
Est. Value
About This Home
This home is located at 933 W 24th St Unit E, Houston, TX 77008 and is currently estimated at $487,652, approximately $221 per square foot. 933 W 24th St Unit E is a home located in Harris County with nearby schools including Sinclair Elementary School, Hamilton Middle, and Waltrip High School.
Ownership History
Date
Name
Owned For
Owner Type
Purchase Details
Closed on
Jan 31, 2024
Sold by
Oelze Joan and Oelze Melody
Bought by
Davis Michelle L and Newman Joseph T
Current Estimated Value
Home Financials for this Owner
Home Financials are based on the most recent Mortgage that was taken out on this home.
Original Mortgage
$407,000
Outstanding Balance
$399,807
Interest Rate
6.61%
Mortgage Type
FHA
Estimated Equity
$87,845
Purchase Details
Closed on
Mar 18, 2020
Sold by
Pollock Penny S
Bought by
Oelze Melody and Oelze Joan
Purchase Details
Closed on
May 16, 2013
Sold by
Homefront Builders Houston Llc
Bought by
Pollock Penny S
Purchase Details
Closed on
Jul 20, 2000
Sold by
Robinson O Chandler
Bought by
Mize Robert Christopher
Purchase Details
Closed on
Jun 15, 1995
Sold by
Burgas Alejandro and Burgas Irma
Bought by
Mize Robert C
Home Financials for this Owner
Home Financials are based on the most recent Mortgage that was taken out on this home.
Original Mortgage
$20,000
Interest Rate
7.8%
Create a Home Valuation Report for This Property
The Home Valuation Report is an in-depth analysis detailing your home's value as well as a comparison with similar homes in the area
Home Values in the Area
Average Home Value in this Area
Purchase History
| Date | Buyer | Sale Price | Title Company |
|---|---|---|---|
| Davis Michelle L | -- | Tradition Title Company | |
| Oelze Melody | -- | Tradition Title Company | |
| Pollock Penny S | -- | Capital Title | |
| Mize Robert Christopher | -- | -- | |
| Mize Robert C | -- | Regency Title |
Source: Public Records
Mortgage History
| Date | Status | Borrower | Loan Amount |
|---|---|---|---|
| Open | Davis Michelle L | $407,000 | |
| Previous Owner | Mize Robert C | $20,000 |
Source: Public Records
Tax History Compared to Growth
Tax History
| Year | Tax Paid | Tax Assessment Tax Assessment Total Assessment is a certain percentage of the fair market value that is determined by local assessors to be the total taxable value of land and additions on the property. | Land | Improvement |
|---|---|---|---|---|
| 2025 | $6,855 | $469,868 | $124,740 | $345,128 |
| 2024 | $6,855 | $460,627 | $124,740 | $335,887 |
| 2023 | $6,855 | $460,249 | $98,010 | $362,239 |
| 2022 | $9,113 | $413,858 | $80,190 | $333,668 |
| 2021 | $7,639 | $327,750 | $80,190 | $247,560 |
| 2020 | $9,771 | $403,488 | $103,445 | $300,043 |
| 2019 | $9,049 | $357,592 | $103,445 | $254,147 |
| 2018 | $9,049 | $357,592 | $103,445 | $254,147 |
| 2017 | $9,042 | $357,592 | $103,445 | $254,147 |
| 2016 | $9,215 | $364,421 | $103,445 | $260,976 |
| 2015 | $9,254 | $391,000 | $98,848 | $292,152 |
| 2014 | $9,254 | $360,000 | $91,951 | $268,049 |
Source: Public Records
Map
Nearby Homes
- 933 W 24th St Unit A
- 904 W 25th St Unit D
- 934 W 24th St
- 940 W 24th St
- 919 W 23rd St
- 931 W 23rd St Unit K
- 931 W 23rd St Unit B
- 1010 W 24th St Unit A
- 953 W 23rd St
- 1009 W 23rd St
- 1011 W 23rd St
- 840 W 26th St
- 1030 W 24th St Unit B
- 1014 W 23rd St
- 1031 W 23rd St
- 816 W 23rd St
- 2653 Fountain Key Blvd
- 1002 W 22nd St
- 1020 W 22nd St Unit A
- 1114 W 25th St
- 933 W 24th St
- 933 W 24th St Unit D
- 933 W 24th St Unit B
- 933 W 24
- 921 W 24th St
- 921 W 24th St Unit D
- 921 W 24th St Unit C
- 921 W 24th St Unit F
- 921 W 24th St Unit A
- 935 W 24th St
- 935 W 24th St Unit D
- 935 W 24th St Unit B
- 935 W 24th St Unit 24TH
- 935 W 24th St Unit A
- 935 W 24th St Unit C
- 935 W 24th St Unit C
- 714 & 720 W 24th St
- 914 W 25th St Unit 9
- 912 W 25th St Unit 4
- 912 W 25th St Unit 1