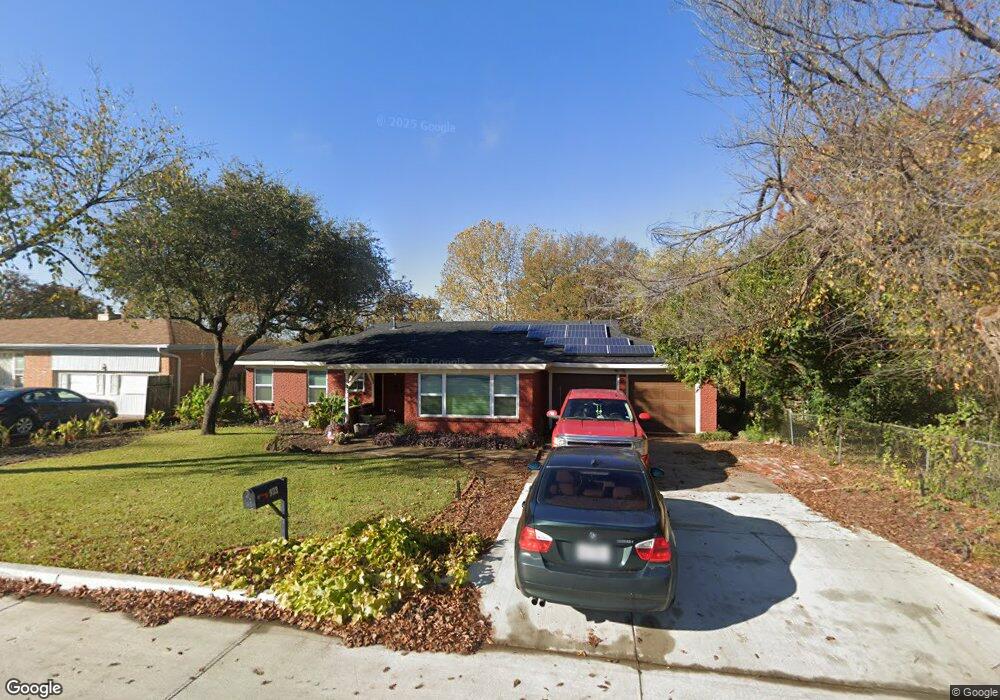
933 Walter St Bedford, TX 76022
Estimated Value: $280,000 - $341,000
3
Beds
2
Baths
1,653
Sq Ft
$185/Sq Ft
Est. Value
About This Home
This home is located at 933 Walter St, Bedford, TX 76022 and is currently estimated at $306,048, approximately $185 per square foot. 933 Walter St is a home located in Tarrant County with nearby schools including Harrison Lane Elementary School, Hurst J High School, and L.D. Bell High School.
Ownership History
Date
Name
Owned For
Owner Type
Purchase Details
Closed on
Nov 21, 2007
Sold by
Winkle Wade W
Bought by
Minor Virginia A and Minor Donny E
Current Estimated Value
Home Financials for this Owner
Home Financials are based on the most recent Mortgage that was taken out on this home.
Original Mortgage
$107,793
Outstanding Balance
$68,377
Interest Rate
6.43%
Mortgage Type
Purchase Money Mortgage
Estimated Equity
$237,671
Purchase Details
Closed on
Jun 12, 2000
Sold by
Rider Cheryl A
Bought by
Winkle Wade W
Home Financials for this Owner
Home Financials are based on the most recent Mortgage that was taken out on this home.
Original Mortgage
$97,450
Interest Rate
8.3%
Mortgage Type
FHA
Purchase Details
Closed on
Aug 18, 1999
Sold by
Bangs Michael S
Bought by
Rider Cheryl A
Purchase Details
Closed on
Aug 11, 1999
Sold by
Bangs Sara Marie and Bangs Marie Suzanne
Bought by
Bangs Michael S
Create a Home Valuation Report for This Property
The Home Valuation Report is an in-depth analysis detailing your home's value as well as a comparison with similar homes in the area
Home Values in the Area
Average Home Value in this Area
Purchase History
| Date | Buyer | Sale Price | Title Company |
|---|---|---|---|
| Minor Virginia A | -- | None Available | |
| Winkle Wade W | -- | Commonwealth Land Title | |
| Rider Cheryl A | -- | Metroplex Title Inc | |
| Bangs Michael S | -- | Metroplex Title Inc |
Source: Public Records
Mortgage History
| Date | Status | Borrower | Loan Amount |
|---|---|---|---|
| Open | Minor Virginia A | $107,793 | |
| Previous Owner | Winkle Wade W | $97,450 |
Source: Public Records
Tax History Compared to Growth
Tax History
| Year | Tax Paid | Tax Assessment Tax Assessment Total Assessment is a certain percentage of the fair market value that is determined by local assessors to be the total taxable value of land and additions on the property. | Land | Improvement |
|---|---|---|---|---|
| 2025 | $2,952 | $278,291 | $55,000 | $223,291 |
| 2024 | $2,952 | $278,291 | $55,000 | $223,291 |
| 2023 | $2,770 | $259,612 | $35,000 | $224,612 |
| 2022 | $4,056 | $222,894 | $35,000 | $187,894 |
| 2021 | $3,977 | $216,323 | $35,000 | $181,323 |
| 2020 | $3,649 | $171,825 | $35,000 | $136,825 |
| 2019 | $3,390 | $176,940 | $35,000 | $141,940 |
| 2018 | $2,578 | $126,844 | $16,000 | $110,844 |
| 2017 | $2,790 | $151,838 | $16,000 | $135,838 |
| 2016 | $2,536 | $124,573 | $16,000 | $108,573 |
| 2015 | $1,993 | $95,300 | $15,000 | $80,300 |
| 2014 | $1,993 | $95,300 | $15,000 | $80,300 |
Source: Public Records
Map
Nearby Homes
- 905 Brown Trail
- 1136 Simpson Dr
- 344 Bedford Ct E
- 341 Hurst Dr
- 1220 Norwood Dr
- 802 Brown Trail
- 803 Glenda Dr
- 1008 Russell Ln
- 116 Oakhurst Dr
- 849 Russell Ln
- 1016 Keith Dr
- 1236 King Dr
- 1348 Norwood Dr
- 501 Merrill Dr
- 1337 Harrison Ln
- 1352 Simpson Dr
- 409 Vicki Place
- 420 Bedford Ct W
- 49 Coffee Tavern Rd
- 127 W Cedar St
- 929 Walter St
- 220 Bedford Ct E
- 216 Bedford Ct E
- 925 Walter St
- 932 Acorn St
- 928 Acorn St
- 212 Bedford Ct E
- 936 Walter St
- 924 Acorn St
- 940 Walter St
- 921 Walter St
- 208 Bedford Ct E
- 944 Walter St
- 928 Walter St
- 920 Acorn St
- 221 Bedford Ct E
- 221 Bedford Ct E Unit 212
- 917 Walter St
- 924 Walter St
- 916 Acorn St