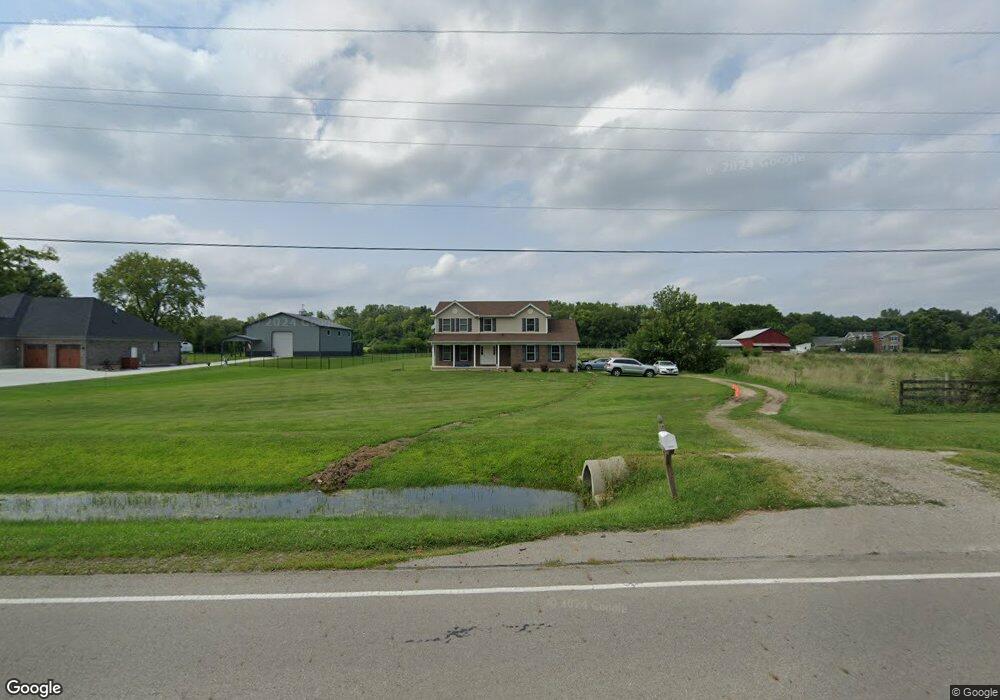
9330 Lower Valley Pike Unit 2b New Carlisle, OH 45344
Estimated Value: $375,000 - $386,000
4
Beds
3
Baths
2,074
Sq Ft
$183/Sq Ft
Est. Value
About This Home
This home is located at 9330 Lower Valley Pike Unit 2b, New Carlisle, OH 45344 and is currently estimated at $379,682, approximately $183 per square foot. 9330 Lower Valley Pike Unit 2b is a home located in Clark County with nearby schools including Donnelsville Elementary School, Park Layne Elementary School, and New Carlisle Elementary School.
Ownership History
Date
Name
Owned For
Owner Type
Purchase Details
Closed on
Oct 29, 2021
Sold by
Gilbert Terra R & David M Jr
Bought by
Anderson Calvin and Anderson Lillian
Current Estimated Value
Home Financials for this Owner
Home Financials are based on the most recent Mortgage that was taken out on this home.
Original Mortgage
$293,939
Interest Rate
3.11%
Mortgage Type
New Conventional
Purchase Details
Closed on
Sep 10, 2014
Sold by
Gilbert Terra R and Gilbert David M
Bought by
Board Of Clark County Commissioners
Purchase Details
Closed on
Mar 20, 2012
Sold by
Delong Lisa M
Bought by
Gilbert Terra R and Gilbert David M
Home Financials for this Owner
Home Financials are based on the most recent Mortgage that was taken out on this home.
Original Mortgage
$187,815
Interest Rate
3.88%
Mortgage Type
Construction
Create a Home Valuation Report for This Property
The Home Valuation Report is an in-depth analysis detailing your home's value as well as a comparison with similar homes in the area
Home Values in the Area
Average Home Value in this Area
Purchase History
| Date | Buyer | Sale Price | Title Company |
|---|---|---|---|
| Anderson Calvin | $291,000 | Home Services Title | |
| Board Of Clark County Commissioners | $390 | Attorney | |
| Gilbert Terra R | $28,900 | Commerce Park Title Agency L |
Source: Public Records
Mortgage History
| Date | Status | Borrower | Loan Amount |
|---|---|---|---|
| Previous Owner | Anderson Calvin | $293,939 | |
| Previous Owner | Gilbert Terra R | $187,815 |
Source: Public Records
Tax History Compared to Growth
Tax History
| Year | Tax Paid | Tax Assessment Tax Assessment Total Assessment is a certain percentage of the fair market value that is determined by local assessors to be the total taxable value of land and additions on the property. | Land | Improvement |
|---|---|---|---|---|
| 2024 | $4,512 | $96,280 | $11,590 | $84,690 |
| 2023 | $4,512 | $96,280 | $11,590 | $84,690 |
| 2022 | $4,520 | $96,280 | $11,590 | $84,690 |
| 2021 | $3,770 | $73,500 | $8,850 | $64,650 |
| 2020 | $3,780 | $73,500 | $8,850 | $64,650 |
| 2019 | $3,884 | $73,500 | $8,850 | $64,650 |
| 2018 | $3,374 | $60,390 | $8,840 | $51,550 |
| 2017 | $3,354 | $60,393 | $8,845 | $51,548 |
| 2016 | $3,212 | $60,393 | $8,845 | $51,548 |
| 2015 | $3,329 | $60,386 | $8,838 | $51,548 |
| 2014 | $3,311 | $60,421 | $8,873 | $51,548 |
| 2013 | $3,318 | $60,421 | $8,873 | $51,548 |
Source: Public Records
Map
Nearby Homes
- 1225 Whaley Rd
- 10265 W Union Rd
- 14 Sunset Dr
- 18 Sunset Dr
- 204 E Main St
- 738 S Medway Carlisle Rd
- 113 W Main St
- 518 Beach Dr
- 2960 Lake Rd
- 326 Kennedy Dr
- 423 Sycamore Rd
- 429 Tulip Rd
- 522 Caldwell Cir
- 956 Styer Dr
- 11315 W National Rd
- 851 Corvette Ave
- 870 Corvette Ave
- 1124 Burket Dr
- 10850 Musselman Rd
- 1115 Frayne Dr
- 9330 Lower Valley Pike
- 9342 Lower Valley Pike
- 9342 Lower Valley Pike Unit 1A
- 9278 Lower Valley Pike
- 9329 Lower Valley Pike
- 9351 Lower Valley Pike
- 9245 Lower Valley Pike
- 9365 Lower Valley Pike
- 9368 Lower Valley Pike
- 9385 Lower Valley Pike
- 9374 Lower Valley Pike
- 9374 Lower Valley Pike
- 9405 Lower Valley Pike
- 9171 Lower Valley Pike
- 9433 Lower Valley Pike
- 9433 Lower Valley Pike
- 9405 Lower Valley Pike
- 9350 Lower Valley Pike
- 9097 Lower Valley Pike
- 1802 S Union Rd