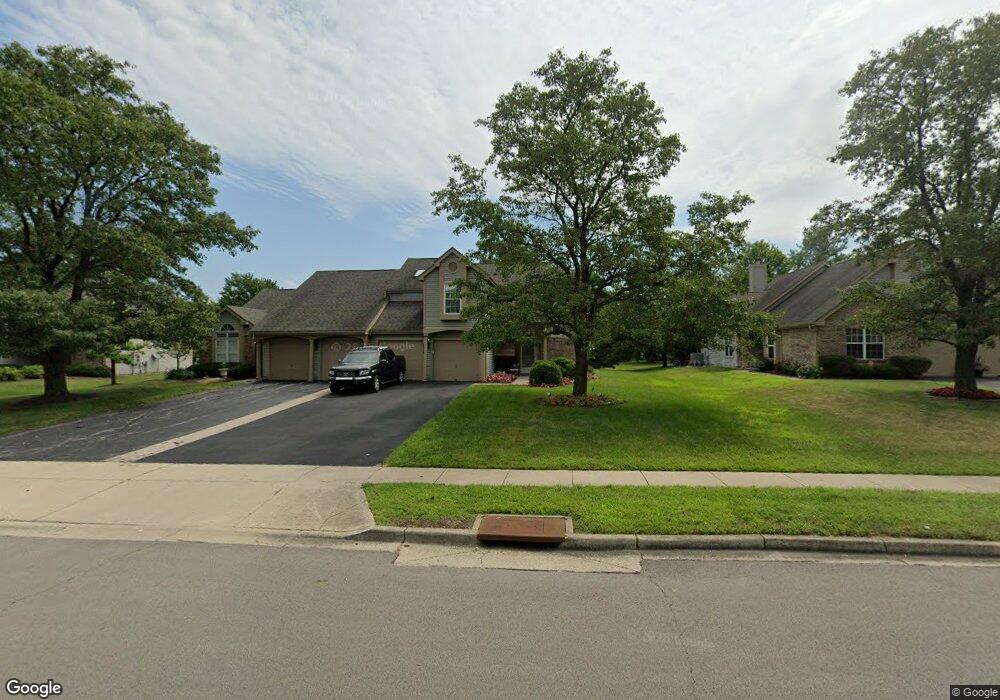
9330 Mandel Dr Unit 89330 Dayton, OH 45458
Estimated Value: $150,000 - $171,000
2
Beds
2
Baths
1,088
Sq Ft
$147/Sq Ft
Est. Value
About This Home
This home is located at 9330 Mandel Dr Unit 89330, Dayton, OH 45458 and is currently estimated at $160,123, approximately $147 per square foot. 9330 Mandel Dr Unit 89330 is a home located in Montgomery County with nearby schools including Primary Village South, Weller Elementary School, and Magsig Middle School.
Ownership History
Date
Name
Owned For
Owner Type
Purchase Details
Closed on
Oct 21, 2021
Sold by
Barber Jessica J and Perez Tiffany J
Bought by
Westerly Rentals Llc
Current Estimated Value
Purchase Details
Closed on
Jul 8, 2021
Sold by
Estate Of Sandra Sue Barber
Bought by
Barber Jessica J and Perez Tiffany J
Purchase Details
Closed on
Aug 4, 2001
Sold by
Cyphers Christina V and Cyphers Chad E
Bought by
Barber Sandra
Purchase Details
Closed on
Mar 31, 1998
Sold by
Burdick Norman C
Bought by
Kraynak Christina V and Kraynak Erica
Home Financials for this Owner
Home Financials are based on the most recent Mortgage that was taken out on this home.
Original Mortgage
$98,910
Interest Rate
7.19%
Mortgage Type
FHA
Purchase Details
Closed on
Nov 10, 1993
Sold by
Price William and Price Freda J
Bought by
Burdick Norman C
Create a Home Valuation Report for This Property
The Home Valuation Report is an in-depth analysis detailing your home's value as well as a comparison with similar homes in the area
Home Values in the Area
Average Home Value in this Area
Purchase History
| Date | Buyer | Sale Price | Title Company |
|---|---|---|---|
| Westerly Rentals Llc | $120,000 | Fidelity Lawyers Ttl Agcy Ll | |
| Barber Jessica J | -- | None Available | |
| Barber Sandra | $103,000 | -- | |
| Kraynak Christina V | $109,900 | -- | |
| Kraynak Christina V | $109,900 | -- | |
| Burdick Norman C | -- | -- |
Source: Public Records
Mortgage History
| Date | Status | Borrower | Loan Amount |
|---|---|---|---|
| Previous Owner | Kraynak Christina V | $98,910 |
Source: Public Records
Tax History Compared to Growth
Tax History
| Year | Tax Paid | Tax Assessment Tax Assessment Total Assessment is a certain percentage of the fair market value that is determined by local assessors to be the total taxable value of land and additions on the property. | Land | Improvement |
|---|---|---|---|---|
| 2024 | $2,785 | $44,990 | $10,940 | $34,050 |
| 2023 | $2,785 | $44,990 | $10,940 | $34,050 |
| 2022 | $2,553 | $32,610 | $7,930 | $24,680 |
| 2021 | $2,560 | $32,610 | $7,930 | $24,680 |
| 2020 | $1,877 | $32,610 | $7,930 | $24,680 |
| 2019 | $1,395 | $24,530 | $7,930 | $16,600 |
| 2018 | $1,247 | $24,530 | $7,930 | $16,600 |
| 2017 | $1,234 | $24,530 | $7,930 | $16,600 |
| 2016 | $1,488 | $26,740 | $7,930 | $18,810 |
| 2015 | $1,464 | $26,740 | $7,930 | $18,810 |
| 2014 | $1,464 | $26,740 | $7,930 | $18,810 |
| 2012 | -- | $31,830 | $7,930 | $23,900 |
Source: Public Records
Map
Nearby Homes
- 118 Marco Ln Unit E17
- 9452 Sugar Bend Trail
- 9618 Whalers Wharf Unit 833
- 1016 Quiet Brook Trail
- 240 Queens Crossing Unit 23121
- 1052 Quiet Brook Trail
- 843 Clareridge Ln Unit 843
- 154 Queens Crossing Unit 31152
- 1071 Star Valley Ct
- 9652 Belfry Ct Unit 29652
- 694 Spring Ridge Place
- 9375 Shawhan Dr
- 9095 Heather Dr
- 184 Edinburgh Village Dr Unit 13184
- 30 Edinburgh Village Dr Unit 530
- 9476 Sheehan Rd
- 9517 Moorgate Ct
- 9183 Mary Haynes Dr
- 9971 Stonemeade Way
- 35 Bywood Ct
- 9336 Mandel Dr Unit 89336
- 9326 Mandel Dr Unit 99326
- 9320 Mandel Dr Unit 99320
- 300 Box Elder Dr
- 9346 Mandel Dr Unit 79346
- 9340 Mandel Dr Unit 79340
- 100 Waterfront Place Unit 1100
- 120 Waterfront Place Unit 41120
- 9356 Mandel Dr Unit 69356
- 9423 Sugar Bend Trail
- 9350 Mandel Dr Unit 69350
- 102 Waterfront Place Unit 1102
- 9421 Sugar Bend Trail
- 9411 Sugar Bend Trail
- 9409 Sugar Bend Trail
- 104 Waterfront Place Unit 1104
- 106 Waterfront Place Unit 1106
- 119 Marco Ln Unit D16
- 113 Marco Ln Unit D13
- 308 Box Elder Dr