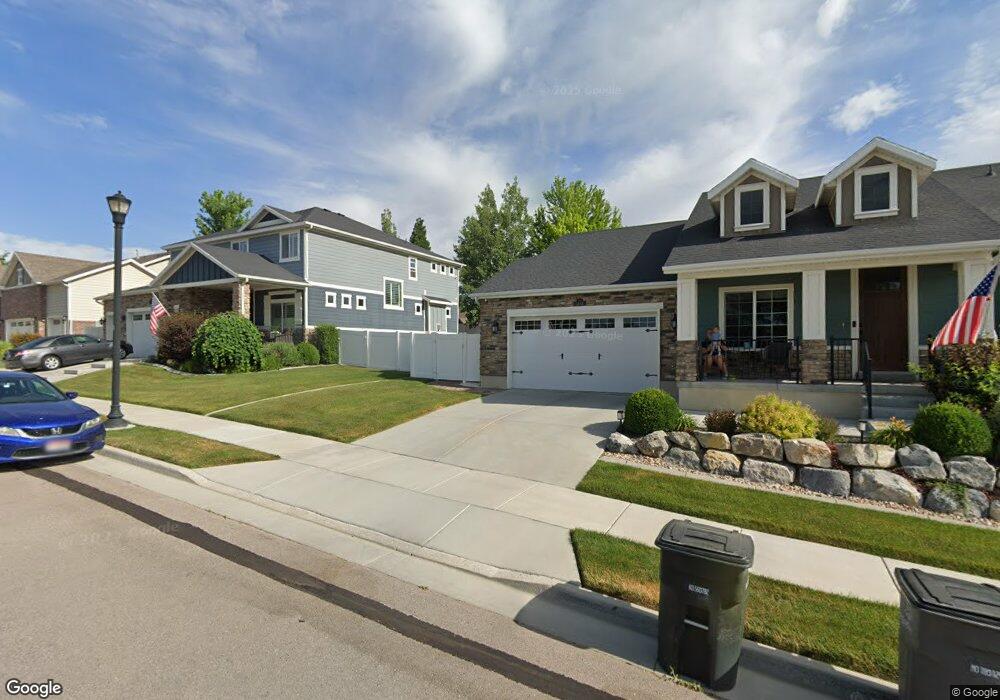
9332 S Avignon Place West Jordan, UT 84088
Estimated Value: $629,936 - $688,000
4
Beds
3
Baths
2,886
Sq Ft
$229/Sq Ft
Est. Value
About This Home
This home is located at 9332 S Avignon Place, West Jordan, UT 84088 and is currently estimated at $661,734, approximately $229 per square foot. 9332 S Avignon Place is a home located in Salt Lake County with nearby schools including Riverside Elementary School, West Jordan Middle School, and West Jordan High School.
Ownership History
Date
Name
Owned For
Owner Type
Purchase Details
Closed on
Feb 3, 2022
Sold by
Barnes Rory D
Bought by
Rory And Cori Barnes Trust
Current Estimated Value
Purchase Details
Closed on
Feb 2, 2022
Sold by
Barnes Rory D
Bought by
Rory And Cori Barnes Trust
Purchase Details
Closed on
Jun 28, 2018
Sold by
Kirkham Christine Hobbs and The Charles R Hobb Trust
Bought by
Barnes Rory D and Barnes Cori L
Purchase Details
Closed on
May 11, 2018
Sold by
Hobbs Hobbs Charles R Charles R and Hobbs Kirkham Christine
Bought by
Kirkham Christine Hobbs and Charles R Hobbs Trust
Purchase Details
Closed on
Aug 3, 2015
Sold by
Hobbs Charles R
Bought by
Charles R Hobbs Trust
Purchase Details
Closed on
Apr 1, 2003
Sold by
Merchant Jeff L
Bought by
Hobbs Charles R and Hobbs Nola D
Purchase Details
Closed on
Sep 20, 2000
Sold by
Trophy Homes Lc
Bought by
Merchant Jeff L and Merchant Wanda L
Create a Home Valuation Report for This Property
The Home Valuation Report is an in-depth analysis detailing your home's value as well as a comparison with similar homes in the area
Home Values in the Area
Average Home Value in this Area
Purchase History
| Date | Buyer | Sale Price | Title Company |
|---|---|---|---|
| Rory And Cori Barnes Trust | -- | Kyle H Barrick | |
| Rory And Cori Barnes Trust | -- | Kyle H Barrick | |
| Barnes Rory D | -- | Artisan Title | |
| Kirkham Christine Hobbs | -- | None Available | |
| Charles R Hobbs Trust | -- | None Available | |
| Hobbs Charles R | -- | Sutherland Title | |
| Merchant Jeff L | -- | First American Title |
Source: Public Records
Tax History Compared to Growth
Tax History
| Year | Tax Paid | Tax Assessment Tax Assessment Total Assessment is a certain percentage of the fair market value that is determined by local assessors to be the total taxable value of land and additions on the property. | Land | Improvement |
|---|---|---|---|---|
| 2025 | $3,014 | $640,000 | $125,300 | $514,700 |
| 2024 | $3,014 | $568,600 | $122,000 | $446,600 |
| 2023 | $3,092 | $550,000 | $156,200 | $393,800 |
| 2022 | $3,152 | $551,600 | $153,200 | $398,400 |
| 2021 | $2,776 | $441,000 | $123,000 | $318,000 |
| 2020 | $2,683 | $399,800 | $117,100 | $282,700 |
| 2019 | $2,661 | $388,700 | $110,500 | $278,200 |
| 2018 | $2,338 | $338,400 | $110,500 | $227,900 |
| 2017 | $2,211 | $318,100 | $110,500 | $207,600 |
| 2016 | $2,137 | $289,000 | $103,600 | $185,400 |
| 2015 | $2,181 | $287,300 | $110,500 | $176,800 |
| 2014 | -- | $271,700 | $105,600 | $166,100 |
Source: Public Records
Map
Nearby Homes
- 9297 S Avignon Place
- 1116 W 9440 S
- 9095 S 1150 W
- 9121 S Hidden Peak Dr
- 1184 W Michaelsen Way
- 9532 S Willow Trail Way
- 8686 S Temple Dr
- 9141 S Little Creek Dr
- 8976 S 1050 W
- 9332 S Chartres Ave
- 885 W Chartres Ave
- 828 W Chartres Ave
- 8843 Capernaum Rd
- 8772 S Midvalley Dr
- 9837 Jordan Ridge Rd
- 1424 Stone Meadow Dr
- 662 W Jefferson Cove
- 9847 S 1000 W
- 8713 Mountain Meadow Dr
- 9144 S Jefferson Place
- 9332 Avignon Place
- 9324 S Avignon Place
- 9324 Avignon Place
- 1146 W Koch Dr
- 9316 S Avignon Place
- 9316 Avignon Place
- 9351 Dutch Valley Dr
- 1152 W Koch Dr
- 1132 W Koch Dr
- 9308 S Avignon Place
- 9308 Avignon Place
- 9323 Avignon Place
- 9323 S Avignon Place
- 9315 S Avignon Place
- 9315 Avignon Place
- 1126 W Koch Dr
- 9331 S Avignon Place
- 9331 Avignon Place
- 1162 W Windmill Hill Way
- 9302 S Avignon Place