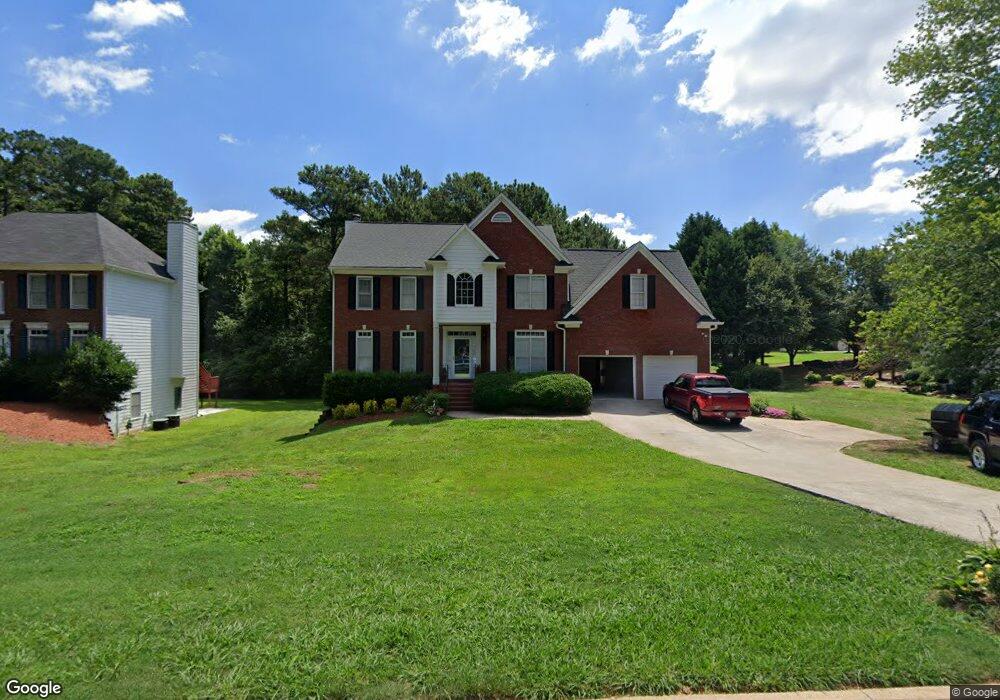
9334 Meadow Gate Ln Jonesboro, GA 30236
Estimated Value: $356,561 - $427,000
6
Beds
4
Baths
3,362
Sq Ft
$118/Sq Ft
Est. Value
About This Home
This home is located at 9334 Meadow Gate Ln, Jonesboro, GA 30236 and is currently estimated at $397,640, approximately $118 per square foot. 9334 Meadow Gate Ln is a home located in Clayton County with nearby schools including Suder Elementary School, M. D. Roberts Middle School, and Jonesboro High School.
Ownership History
Date
Name
Owned For
Owner Type
Purchase Details
Closed on
Nov 10, 2011
Sold by
Mack Carolyn B
Bought by
Brown Carlotta H
Current Estimated Value
Home Financials for this Owner
Home Financials are based on the most recent Mortgage that was taken out on this home.
Original Mortgage
$146,197
Outstanding Balance
$100,430
Interest Rate
4.25%
Mortgage Type
FHA
Estimated Equity
$297,210
Purchase Details
Closed on
Mar 29, 2001
Sold by
Mack Kenneth L
Bought by
Mack Kenneth L and Mack Carolyn B
Home Financials for this Owner
Home Financials are based on the most recent Mortgage that was taken out on this home.
Original Mortgage
$256,500
Interest Rate
7.01%
Mortgage Type
New Conventional
Purchase Details
Closed on
Nov 10, 1995
Sold by
Wieland Homes
Bought by
Staten Kenneth Carolyn
Create a Home Valuation Report for This Property
The Home Valuation Report is an in-depth analysis detailing your home's value as well as a comparison with similar homes in the area
Home Values in the Area
Average Home Value in this Area
Purchase History
| Date | Buyer | Sale Price | Title Company |
|---|---|---|---|
| Brown Carlotta H | $150,000 | -- | |
| Mack Kenneth L | -- | -- | |
| Mack Kenneth L | $270,000 | -- | |
| Staten Kenneth Carolyn | $191,400 | -- |
Source: Public Records
Mortgage History
| Date | Status | Borrower | Loan Amount |
|---|---|---|---|
| Open | Brown Carlotta H | $146,197 | |
| Previous Owner | Mack Kenneth L | $256,500 | |
| Closed | Staten Kenneth Carolyn | $0 |
Source: Public Records
Tax History Compared to Growth
Tax History
| Year | Tax Paid | Tax Assessment Tax Assessment Total Assessment is a certain percentage of the fair market value that is determined by local assessors to be the total taxable value of land and additions on the property. | Land | Improvement |
|---|---|---|---|---|
| 2024 | $5,504 | $150,120 | $9,600 | $140,520 |
| 2023 | $5,198 | $143,960 | $9,600 | $134,360 |
| 2022 | $4,572 | $125,520 | $9,600 | $115,920 |
| 2021 | $3,210 | $90,320 | $9,600 | $80,720 |
| 2020 | $3,759 | $103,027 | $9,600 | $93,427 |
| 2019 | $3,675 | $99,601 | $9,600 | $90,001 |
| 2018 | $4,147 | $111,210 | $9,600 | $101,610 |
| 2017 | $3,550 | $96,308 | $9,600 | $86,708 |
| 2016 | $3,434 | $93,459 | $9,600 | $83,859 |
| 2015 | $3,174 | $0 | $0 | $0 |
| 2014 | $2,384 | $68,974 | $9,600 | $59,374 |
Source: Public Records
Map
Nearby Homes
- 9361 Arbor Glen Ct Unit 13
- 9260 Betony Wood Trail
- 9396 Fairfield Pkwy
- 9342 Carillon Ct
- 9307 Glenleigh Way
- 1935 Watercrest Dr
- 9261 Glenleigh Way
- 2106 Fair Ridge Ct
- 9243 Seminole Rd
- 9419 Rocky Creek
- 2105 Fair Ridge Ct
- 9510 Creekside Rd
- 1814 Deer Crossing Way
- 1720 Byrom Pkwy Unit 2
- 9163 Retreat Pass
- 1770 Deer Crossing Cir
- 9344 Hidden Hollow Trail
- 2283 Noahs Ark Rd
- 9492 Deer Crossing Trace
- 9176 Chickasaw Ct
- 9324 Meadow Gate Ln
- 9344 Meadow Gate Ln
- 2054 Fairmont Run Unit 13
- 9318 Meadow Gate Ln
- 9337 Meadow Gate Ln
- 9329 Meadow Gate Ln Unit XV
- 9345 Meadow Gate Ln
- 2066 Fairmont Run
- 9358 Meadow Gate Ln
- 9321 Meadow Gate Ln
- 0 Meadow Gate Ln Unit 8593712
- 0 Meadow Gate Ln Unit 8160638
- 0 Meadow Gate Ln
- 9353 Meadow Gate Ln
- 9314 Meadow Gate Ln Unit XV
- 2055 Fairmont Run
- 9316 Arbor Glen Ct
- 9315 Meadow Gate Ln
- 9361 Meadow Gate Ln
- 9311 Meadow Gate Ln