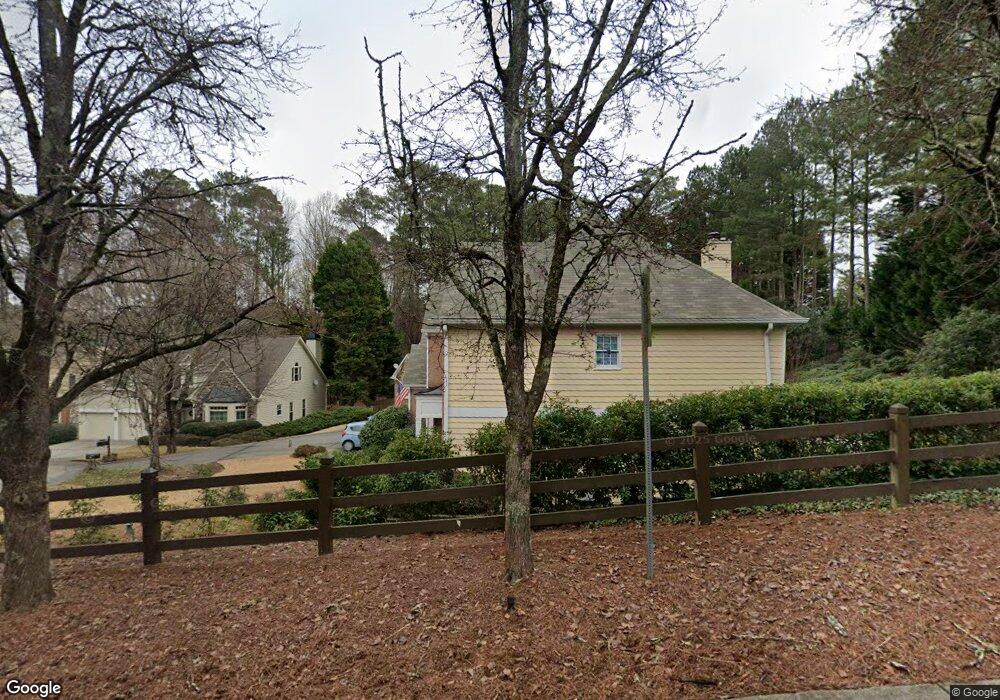
9335 Coleherne Ct Unit 1 Alpharetta, GA 30022
Estimated Value: $687,000 - $850,000
3
Beds
3
Baths
3,682
Sq Ft
$206/Sq Ft
Est. Value
About This Home
This home is located at 9335 Coleherne Ct Unit 1, Alpharetta, GA 30022 and is currently estimated at $758,161, approximately $205 per square foot. 9335 Coleherne Ct Unit 1 is a home located in Fulton County with nearby schools including State Bridge Crossing Elementary School, Autrey Mill Middle School, and Johns Creek High School.
Ownership History
Date
Name
Owned For
Owner Type
Purchase Details
Closed on
Aug 27, 2003
Sold by
Hunt Craig L and Hunt Alice M
Bought by
Snyder Meredith
Current Estimated Value
Home Financials for this Owner
Home Financials are based on the most recent Mortgage that was taken out on this home.
Original Mortgage
$167,600
Interest Rate
5.75%
Mortgage Type
New Conventional
Purchase Details
Closed on
Sep 30, 1999
Sold by
Moody Bruced L
Bought by
Hunt Craig L and Hunt Alice M
Home Financials for this Owner
Home Financials are based on the most recent Mortgage that was taken out on this home.
Original Mortgage
$24,500
Interest Rate
7.79%
Mortgage Type
New Conventional
Purchase Details
Closed on
Mar 23, 1994
Sold by
Dubose Coldstream Ltd
Bought by
Moody Bruce L
Home Financials for this Owner
Home Financials are based on the most recent Mortgage that was taken out on this home.
Original Mortgage
$195,750
Interest Rate
7.2%
Create a Home Valuation Report for This Property
The Home Valuation Report is an in-depth analysis detailing your home's value as well as a comparison with similar homes in the area
Home Values in the Area
Average Home Value in this Area
Purchase History
| Date | Buyer | Sale Price | Title Company |
|---|---|---|---|
| Snyder Meredith | $272,000 | -- | |
| Hunt Craig L | $245,000 | -- | |
| Moody Bruce L | $217,500 | -- |
Source: Public Records
Mortgage History
| Date | Status | Borrower | Loan Amount |
|---|---|---|---|
| Previous Owner | Snyder Meredith | $167,600 | |
| Previous Owner | Hunt Craig L | $24,500 | |
| Previous Owner | Moody Bruce L | $195,750 |
Source: Public Records
Tax History Compared to Growth
Tax History
| Year | Tax Paid | Tax Assessment Tax Assessment Total Assessment is a certain percentage of the fair market value that is determined by local assessors to be the total taxable value of land and additions on the property. | Land | Improvement |
|---|---|---|---|---|
| 2025 | $4,272 | $184,520 | $35,960 | $148,560 |
| 2023 | $4,272 | $209,240 | $35,960 | $173,280 |
| 2022 | $4,118 | $221,480 | $36,360 | $185,120 |
| 2021 | $4,066 | $170,040 | $31,520 | $138,520 |
| 2020 | $3,988 | $142,120 | $32,520 | $109,600 |
| 2019 | $466 | $139,640 | $31,960 | $107,680 |
| 2018 | $4,042 | $136,360 | $31,200 | $105,160 |
| 2017 | $3,857 | $125,480 | $23,160 | $102,320 |
| 2016 | $3,793 | $125,480 | $23,160 | $102,320 |
| 2015 | $3,834 | $125,480 | $23,160 | $102,320 |
| 2014 | $3,965 | $125,480 | $23,160 | $102,320 |
Source: Public Records
Map
Nearby Homes
- 5005 Johns Creek Ct
- 9410 Knollcrest Blvd
- 1650 Stethem Ferry
- 1950 Stethem Ferry
- 9435 Clublands Dr
- 5255 Buice Rd
- 264 Summerour Vale
- 9240 Prestwick Club Dr
- 5590 Broad River View
- 5195 Bandolino Ln
- 5570 Broad River View
- 5205 Bandolino Ln
- 5550 Broad River View
- 5435 Chelsen Wood Dr
- 5715 Broad River View
- 5693 Broad River View
- 5472 Bandolino Ln Unit 419
- 5693 Broad River View Unit 443
- 5715 Broad River View Unit 449
- 370 Royal Birkdale Ct
- 9325 Coleherne Ct
- 9345 Coleherne Ct
- 9355 Coleherne Ct
- 9320 Coleherne Ct
- 9365 Coleherne Ct
- 9375 Coleherne Ct Unit 1
- 5060 Dinant Dr
- 9675 Knollcrest Blvd Unit 3
- 9340 Coleherne Ct Unit 1
- 9330 Coleherne Ct
- 9370 Coleherne Ct
- 9350 Coleherne Ct
- 0 Coleherne Ct Unit 7308724
- 0 Coleherne Ct Unit 7004612
- 0 Coleherne Ct Unit 8241060
- 0 Coleherne Ct Unit 7563922
- 0 Coleherne Ct Unit 8240826
- 0 Coleherne Ct Unit 3154726
- 0 Coleherne Ct Unit 8579427
- 0 Coleherne Ct Unit 7000500