9339 W Chapel Rd Andrews, IN 46702
Estimated Value: $161,000 - $233,000
About This Home
This home is located at 9339 W Chapel Rd, Andrews, IN 46702 and is currently estimated at $195,214, approximately $145 per square foot. 9339 W Chapel Rd is a home located in Huntington County with nearby schools including Lancaster Elementary School and Huntington North High School.
Ownership History
We collect this data history from publicly available records. To have your information removed, we recommend requesting removal directly through your county’s website.
Purchase Details
Home Financials for this Owner
Home Financials are based on the most recent Mortgage that was taken out on this home.Purchase Details
Purchase Details
Purchase Details
Purchase History
We collect this data history from publicly available records. To have your information removed, we recommend requesting removal directly through your county’s website.
| Date | Buyer | Sale Price | Title Company |
|---|---|---|---|
| -- | Attorney | ||
| $69,900 | Metz Title Company Inc | ||
| -- | None Available | ||
| $45,079 | None Available |
Mortgage History
We collect this data history from publicly available records. To have your information removed, we recommend requesting removal directly through your county’s website.
| Date | Status | Borrower | Loan Amount |
|---|---|---|---|
| Open | $84,442 |
Tax History
We collect this data history from publicly available records. To have your information removed, we recommend requesting removal directly through your county’s website.
| Year | Tax Paid | Tax Assessment Tax Assessment Total Assessment is a certain percentage of the fair market value that is determined by local assessors to be the total taxable value of land and additions on the property. | Land | Improvement |
|---|---|---|---|---|
| 2025 | $574 | $140,100 | $18,600 | $121,500 |
| 2024 | $574 | $109,600 | $18,600 | $91,000 |
| 2023 | $596 | $110,900 | $18,600 | $92,300 |
| 2022 | $507 | $100,400 | $18,600 | $81,800 |
| 2021 | $396 | $85,000 | $18,600 | $66,400 |
| 2020 | $419 | $85,900 | $18,600 | $67,300 |
| 2019 | $320 | $79,500 | $18,600 | $60,900 |
| 2018 | $331 | $78,300 | $18,600 | $59,700 |
| 2017 | $268 | $70,800 | $18,600 | $52,200 |
| 2016 | $217 | $63,900 | $18,600 | $45,300 |
| 2014 | $260 | $63,300 | $18,600 | $44,700 |
| 2013 | $260 | $64,700 | $18,600 | $46,100 |
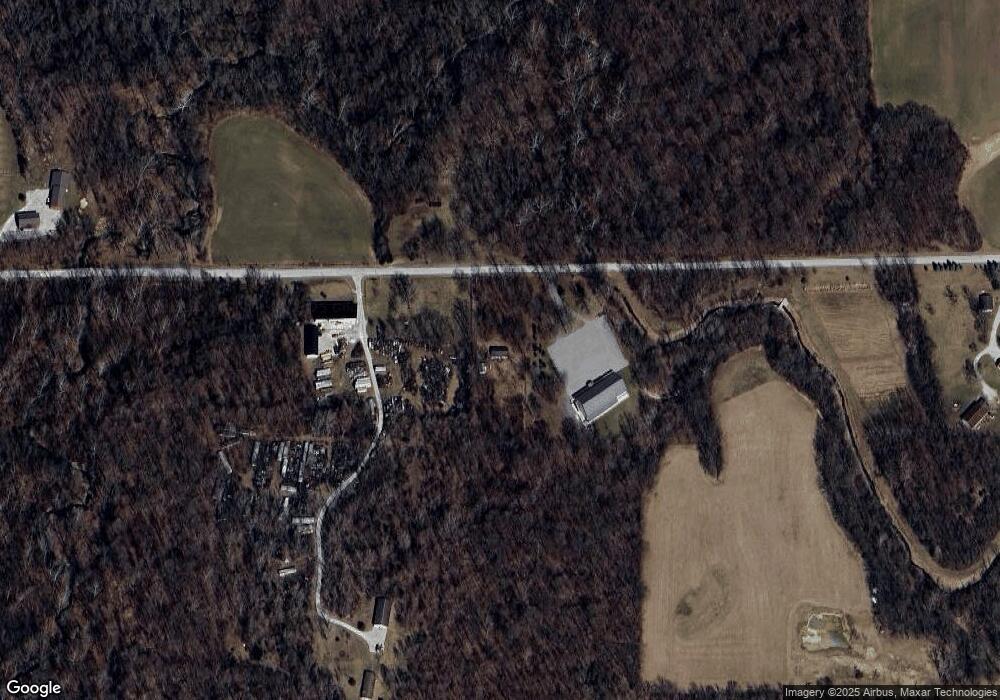
Map
- 8937 S 900 W
- 6060 W County Line Rd
- 6213 S 594 W
- 6420 S 400 W
- 2588 S 300 E
- 6673 E Blue Star Hwy
- 5984 E Blue Star Hwy
- 436 W Bellville Ave
- 512 E Kendall St
- 63 E Mckeever St
- 161 S Jackson St
- 172 N Main St
- 251 N Snowden St
- 586 N Jackson St
- 9673 S 200 E
- 3025 Trappers Cove
- 6227 N 600 E
- 4691 E 550 N
- 4497 W 200 N Unit 47
- 4497 W 200 N Unit 68
- 9332 W 500 N
- 9407 W Chapel Rd
- 9560 W Chapel Rd
- 9039 W Chapel Rd
- 9625 W Chapel Rd
- 5214 S 900 W
- 4633 S 900 W
- 9757 W Chapel Rd
- 9819 W Chapel Rd
- 5399 S 900 W
- 9601 Lost Bridge Rd W
- 9601 1/2 Lost Bridge Rd W
- 9701 Lost Bridge Rd W
- 4367 S 900 W
- 9862 W Chapel Rd
- 9759 Lost Bridge Rd W
- 5389 S 900 W
- 9965 W Chapel Rd
- 4140 S New Holland Rd
- 5048 S 800 E
Ask me questions while you tour the home.