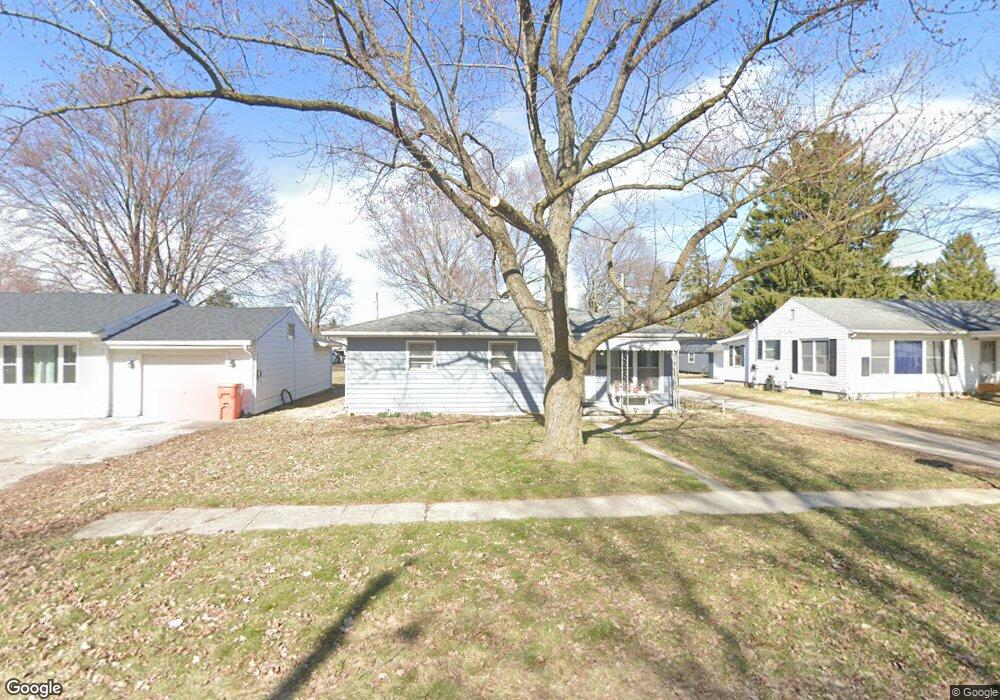
934 Central Ave Findlay, OH 45840
Estimated Value: $150,000 - $175,012
3
Beds
1
Bath
1,064
Sq Ft
$156/Sq Ft
Est. Value
About This Home
This home is located at 934 Central Ave, Findlay, OH 45840 and is currently estimated at $165,753, approximately $155 per square foot. 934 Central Ave is a home located in Hancock County with nearby schools including Whittier Primary School, Bigelow Hill Elementary School, and Glenwood Middle School.
Ownership History
Date
Name
Owned For
Owner Type
Purchase Details
Closed on
Dec 2, 2024
Sold by
Bartolomeo Cynthia Sue and Powell Marcus E
Bought by
Thornhill Julia A and Webster Devin J
Current Estimated Value
Home Financials for this Owner
Home Financials are based on the most recent Mortgage that was taken out on this home.
Original Mortgage
$170,058
Outstanding Balance
$168,009
Interest Rate
6.54%
Mortgage Type
FHA
Estimated Equity
-$2,256
Purchase Details
Closed on
Mar 8, 2024
Sold by
Powell Sheryl J
Bought by
Powell Marcus E
Purchase Details
Closed on
May 6, 2002
Sold by
Moore Burris P
Bought by
Powell Sheryl J
Home Financials for this Owner
Home Financials are based on the most recent Mortgage that was taken out on this home.
Original Mortgage
$62,009
Interest Rate
7.18%
Mortgage Type
FHA
Purchase Details
Closed on
Jan 27, 1992
Bought by
Moore Burris P
Purchase Details
Closed on
Sep 23, 1991
Bought by
Heminger Delbert Lee
Create a Home Valuation Report for This Property
The Home Valuation Report is an in-depth analysis detailing your home's value as well as a comparison with similar homes in the area
Home Values in the Area
Average Home Value in this Area
Purchase History
| Date | Buyer | Sale Price | Title Company |
|---|---|---|---|
| Thornhill Julia A | $173,200 | Golden Key Title | |
| Powell Marcus E | -- | None Listed On Document | |
| Powell Marcus E | -- | None Listed On Document | |
| Powell Sheryl J | $62,500 | -- | |
| Moore Burris P | $30,700 | -- | |
| Heminger Delbert Lee | -- | -- |
Source: Public Records
Mortgage History
| Date | Status | Borrower | Loan Amount |
|---|---|---|---|
| Open | Thornhill Julia A | $170,058 | |
| Previous Owner | Powell Sheryl J | $62,009 |
Source: Public Records
Tax History
| Year | Tax Paid | Tax Assessment Tax Assessment Total Assessment is a certain percentage of the fair market value that is determined by local assessors to be the total taxable value of land and additions on the property. | Land | Improvement |
|---|---|---|---|---|
| 2024 | $1,363 | $38,380 | $4,320 | $34,060 |
| 2023 | $1,039 | $38,380 | $4,320 | $34,060 |
| 2022 | $1,050 | $38,380 | $4,320 | $34,060 |
| 2021 | $926 | $31,510 | $4,550 | $26,960 |
| 2020 | $926 | $31,510 | $4,550 | $26,960 |
| 2019 | $908 | $31,510 | $4,550 | $26,960 |
| 2018 | $729 | $25,530 | $3,960 | $21,570 |
| 2017 | $730 | $25,530 | $3,960 | $21,570 |
| 2016 | $731 | $25,530 | $3,960 | $21,570 |
| 2015 | $496 | $20,100 | $2,380 | $17,720 |
| 2014 | $496 | $20,100 | $2,380 | $17,720 |
| 2012 | $886 | $20,100 | $2,380 | $17,720 |
Source: Public Records
Map
Nearby Homes
- 716 Winfield Ave
- 322 Midland Ave
- 420 H St
- 204 Laquineo St
- 301 Allen Ave
- 439 Carnahan Ave
- 1500 Crystal Ave
- 1125 Glen Meadow Dr
- 1062 Vincent St
- 206 Midland Ave
- 1142 Concord Ct
- 1216 Concord Ct
- 523 Center St
- 1308 Greendale Ave
- 213 Cherry St
- 1725 Parkside Place
- 0 Sheridan Ave
- 1030 Sheridan Ave
- 706 N Cory St
- 512 N Cory St