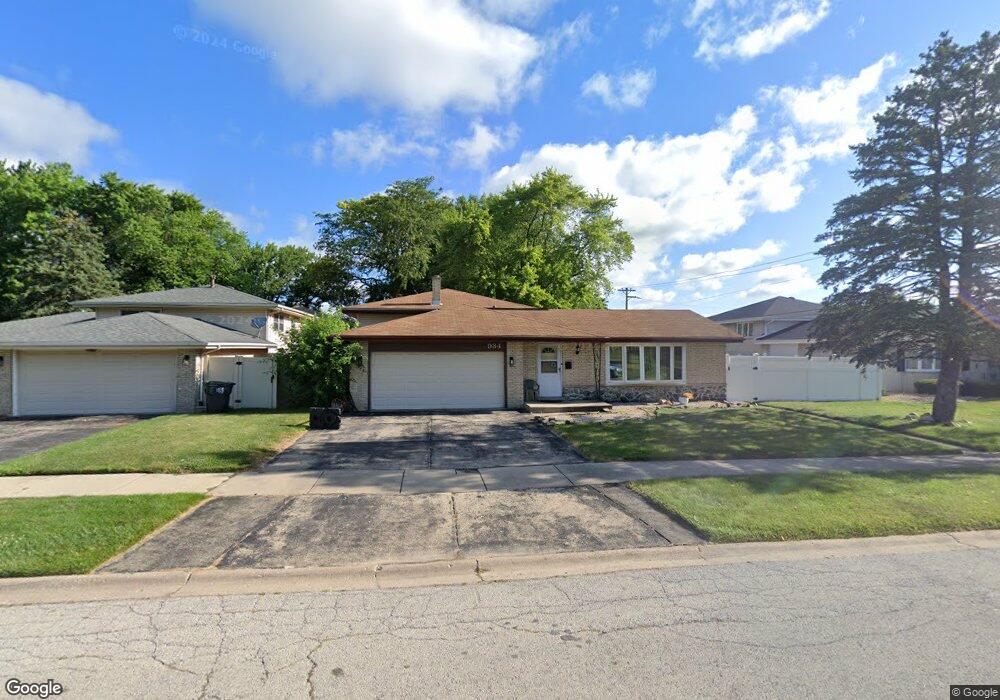
934 E 172nd St South Holland, IL 60473
Central District NeighborhoodEstimated Value: $252,408 - $316,000
4
Beds
2
Baths
1,498
Sq Ft
$190/Sq Ft
Est. Value
About This Home
This home is located at 934 E 172nd St, South Holland, IL 60473 and is currently estimated at $284,352, approximately $189 per square foot. 934 E 172nd St is a home located in Cook County with nearby schools including Greenwood Elementary School, Mckinley Elementary School, and Mckinley Jr High School.
Ownership History
Date
Name
Owned For
Owner Type
Purchase Details
Closed on
Feb 19, 2015
Sold by
Hampton Jessica A and Greenfield Jessica A
Bought by
Hampton Jessica A
Current Estimated Value
Home Financials for this Owner
Home Financials are based on the most recent Mortgage that was taken out on this home.
Original Mortgage
$112,455
Outstanding Balance
$39,850
Interest Rate
3.73%
Mortgage Type
New Conventional
Estimated Equity
$244,502
Purchase Details
Closed on
Jul 29, 1998
Sold by
Selvick John and Selvick Kimberly
Bought by
Greenfield Ronald D and Greenfield Jessica A
Home Financials for this Owner
Home Financials are based on the most recent Mortgage that was taken out on this home.
Original Mortgage
$141,411
Interest Rate
6.99%
Mortgage Type
FHA
Purchase Details
Closed on
Aug 8, 1995
Sold by
Paytosh Carol C
Bought by
Selvick John and Selvick Kimberly
Home Financials for this Owner
Home Financials are based on the most recent Mortgage that was taken out on this home.
Original Mortgage
$90,000
Interest Rate
7.64%
Create a Home Valuation Report for This Property
The Home Valuation Report is an in-depth analysis detailing your home's value as well as a comparison with similar homes in the area
Home Values in the Area
Average Home Value in this Area
Purchase History
| Date | Buyer | Sale Price | Title Company |
|---|---|---|---|
| Hampton Jessica A | -- | First American Title Ins Co | |
| Greenfield Ronald D | $146,000 | -- | |
| Selvick John | $120,000 | Equity Title |
Source: Public Records
Mortgage History
| Date | Status | Borrower | Loan Amount |
|---|---|---|---|
| Open | Hampton Jessica A | $112,455 | |
| Closed | Greenfield Ronald D | $141,411 | |
| Previous Owner | Selvick John | $90,000 |
Source: Public Records
Tax History Compared to Growth
Tax History
| Year | Tax Paid | Tax Assessment Tax Assessment Total Assessment is a certain percentage of the fair market value that is determined by local assessors to be the total taxable value of land and additions on the property. | Land | Improvement |
|---|---|---|---|---|
| 2024 | $7,671 | $20,000 | $3,975 | $16,025 |
| 2023 | $6,760 | $20,000 | $3,975 | $16,025 |
| 2022 | $6,760 | $14,876 | $3,433 | $11,443 |
| 2021 | $6,543 | $14,875 | $3,432 | $11,443 |
| 2020 | $6,293 | $14,875 | $3,432 | $11,443 |
| 2019 | $5,833 | $14,113 | $2,890 | $11,223 |
| 2018 | $5,566 | $14,113 | $2,890 | $11,223 |
| 2017 | $5,472 | $14,113 | $2,890 | $11,223 |
| 2016 | $5,214 | $13,001 | $2,710 | $10,291 |
| 2015 | $4,986 | $13,001 | $2,710 | $10,291 |
| 2014 | $4,888 | $13,001 | $2,710 | $10,291 |
| 2013 | $4,103 | $12,117 | $2,710 | $9,407 |
Source: Public Records
Map
Nearby Homes
- 17148 Evans Dr
- 17129 Greenwood Ave
- 949 E 170th St
- 17120 University Ave
- 17324 Greenwood Ave
- 17032 University Ave
- 17006 University Ave
- 17060 Evans Dr
- 739 E 170th St
- 636 E 173rd St
- 16921 Ingleside Ave
- 947 E 169th St
- 811 E 169th Place
- 17249 School St
- 16927 Langley Ave
- 630 E 170th St
- 1158 E 169th St
- 16901 School St
- 16914 Parkside Ave
- 1320 E 169th Place
- 942 E 172nd St
- 928 E 172nd St
- 17149 Ingleside Ave
- 948 E 172nd St
- 17143 Ingleside Ave
- 949 E 171st Place
- 17200 Ellis Ct
- 954 E 172nd St
- 17139 Ingleside Ave
- 955 E 171st Place
- 942 E 171st Place
- 942 E 171st Place
- 942 E 171st Place
- 17208 Ellis Ct
- 910 E 172nd St
- 17150 Ingleside Ave
- 960 E 172nd St
- 17133 Ingleside Ave
- 17146 Ingleside Ave
- 17216 Ellis Ct