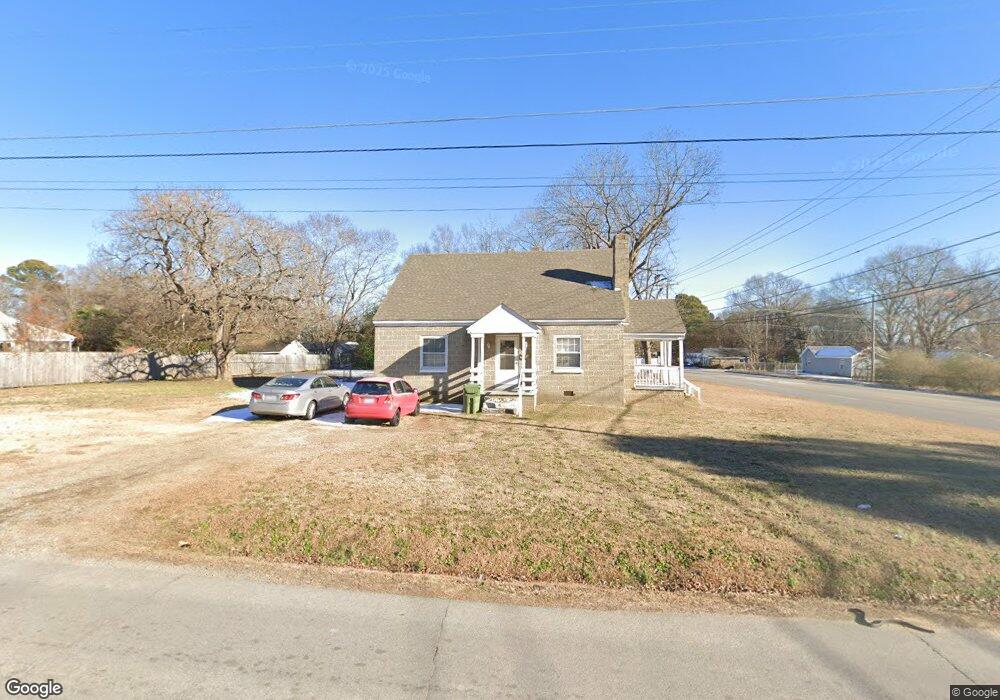
934 Oakley Ave Roanoke Rapids, NC 27870
Estimated Value: $118,000 - $152,000
3
Beds
2
Baths
1,500
Sq Ft
$92/Sq Ft
Est. Value
About This Home
This home is located at 934 Oakley Ave, Roanoke Rapids, NC 27870 and is currently estimated at $138,152, approximately $92 per square foot. 934 Oakley Ave is a home located in Halifax County with nearby schools including Roanoke Rapids High School and Victory Christian Academy.
Ownership History
Date
Name
Owned For
Owner Type
Purchase Details
Closed on
Aug 22, 2024
Sold by
Stainback Land Trust and Schoenherr G
Bought by
Oakley Land Trust
Current Estimated Value
Purchase Details
Closed on
Aug 29, 2008
Sold by
Garrett M J and Garrett Gayle L
Bought by
Schoenherr G L and The Stainback Land Trust
Purchase Details
Closed on
Mar 15, 2007
Sold by
Jones C E and Jones Barbara P
Bought by
Garrett M J
Purchase Details
Closed on
Apr 18, 2006
Sold by
Swarr Jeffrey Adam and Swarr Laura Lyane
Bought by
Garrett M J and Garrett Jones C
Create a Home Valuation Report for This Property
The Home Valuation Report is an in-depth analysis detailing your home's value as well as a comparison with similar homes in the area
Home Values in the Area
Average Home Value in this Area
Purchase History
| Date | Buyer | Sale Price | Title Company |
|---|---|---|---|
| Oakley Land Trust | -- | None Listed On Document | |
| Schoenherr G L | -- | None Available | |
| Garrett M J | $35,000 | None Available | |
| Garrett M J | $70,500 | None Available |
Source: Public Records
Tax History Compared to Growth
Tax History
| Year | Tax Paid | Tax Assessment Tax Assessment Total Assessment is a certain percentage of the fair market value that is determined by local assessors to be the total taxable value of land and additions on the property. | Land | Improvement |
|---|---|---|---|---|
| 2025 | $17 | $90,300 | $18,400 | $71,900 |
| 2024 | $17 | $90,300 | $18,400 | $71,900 |
| 2023 | $1,549 | $76,000 | $18,400 | $57,600 |
| 2022 | $1,556 | $76,000 | $18,400 | $57,600 |
| 2021 | $1,499 | $76,000 | $18,400 | $57,600 |
| 2020 | $1,498 | $76,000 | $18,400 | $57,600 |
| 2019 | $1,436 | $71,300 | $18,400 | $52,900 |
| 2018 | $1,404 | $71,300 | $18,400 | $52,900 |
| 2017 | $1,397 | $71,300 | $18,400 | $52,900 |
| 2016 | $1,444 | $71,300 | $18,400 | $52,900 |
| 2015 | $1,379 | $71,300 | $18,400 | $52,900 |
| 2014 | $1,373 | $74,430 | $19,940 | $54,490 |
Source: Public Records
Map
Nearby Homes