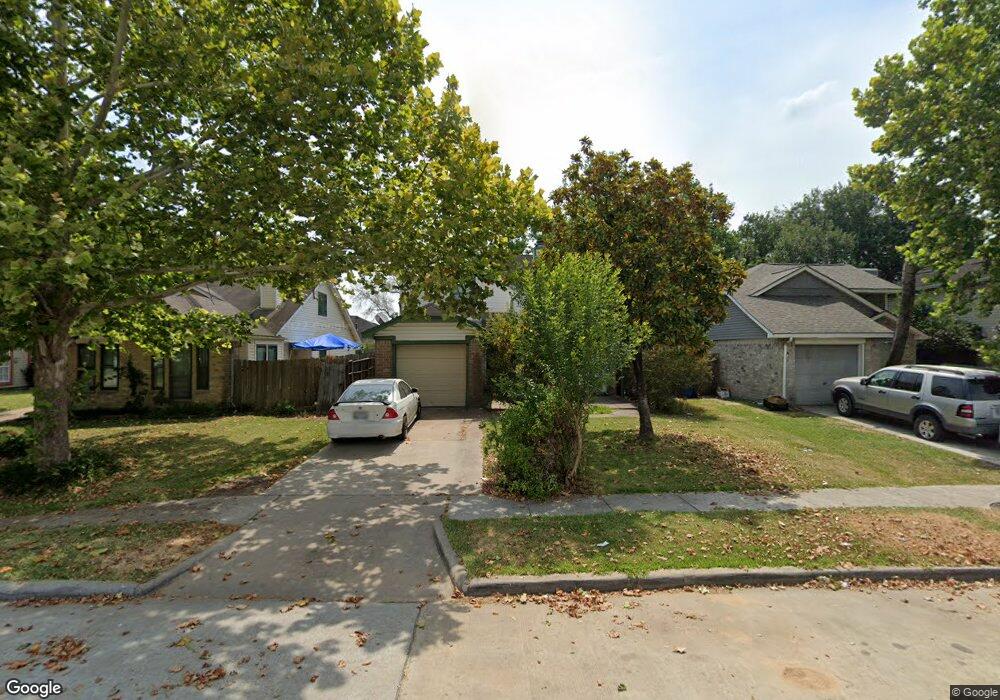
934 Pennygent Ln Channelview, TX 77530
Estimated Value: $195,291 - $220,000
3
Beds
2
Baths
1,588
Sq Ft
$133/Sq Ft
Est. Value
About This Home
This home is located at 934 Pennygent Ln, Channelview, TX 77530 and is currently estimated at $210,573, approximately $132 per square foot. 934 Pennygent Ln is a home located in Harris County with nearby schools including Channelview High School, Family Christian Academy, and Creative Corner.
Ownership History
Date
Name
Owned For
Owner Type
Purchase Details
Closed on
Jun 26, 2024
Sold by
Zachariah Jacob
Bought by
Zachariah Jacob and Zachariah Shiby J
Current Estimated Value
Home Financials for this Owner
Home Financials are based on the most recent Mortgage that was taken out on this home.
Original Mortgage
$147,750
Outstanding Balance
$145,995
Interest Rate
7.02%
Mortgage Type
New Conventional
Estimated Equity
$64,578
Purchase Details
Closed on
Sep 15, 2014
Sold by
Richmond Ltanya Jones
Bought by
Zachariah Jacob
Purchase Details
Closed on
Nov 5, 2008
Sold by
Richmond Werner L
Bought by
Richmond Ltanya
Purchase Details
Closed on
Dec 15, 1997
Sold by
Rudy Donald A and Rudy Starr L
Bought by
Richmond L Tanya Jones
Home Financials for this Owner
Home Financials are based on the most recent Mortgage that was taken out on this home.
Original Mortgage
$59,050
Interest Rate
7.22%
Create a Home Valuation Report for This Property
The Home Valuation Report is an in-depth analysis detailing your home's value as well as a comparison with similar homes in the area
Home Values in the Area
Average Home Value in this Area
Purchase History
| Date | Buyer | Sale Price | Title Company |
|---|---|---|---|
| Zachariah Jacob | -- | None Listed On Document | |
| Zachariah Jacob | -- | None Available | |
| Richmond Ltanya | -- | None Available | |
| Richmond L Tanya Jones | -- | American Title Company |
Source: Public Records
Mortgage History
| Date | Status | Borrower | Loan Amount |
|---|---|---|---|
| Open | Zachariah Jacob | $147,750 | |
| Previous Owner | Richmond L Tanya Jones | $59,050 |
Source: Public Records
Tax History Compared to Growth
Tax History
| Year | Tax Paid | Tax Assessment Tax Assessment Total Assessment is a certain percentage of the fair market value that is determined by local assessors to be the total taxable value of land and additions on the property. | Land | Improvement |
|---|---|---|---|---|
| 2025 | $3,362 | $144,851 | $31,894 | $112,957 |
| 2024 | $3,362 | $164,500 | $31,894 | $132,606 |
| 2023 | $3,362 | $176,808 | $31,894 | $144,914 |
| 2022 | $3,541 | $148,924 | $31,894 | $117,030 |
| 2021 | $3,470 | $137,801 | $31,894 | $105,907 |
| 2020 | $3,144 | $114,264 | $28,917 | $85,347 |
| 2019 | $3,388 | $118,429 | $28,917 | $89,512 |
| 2018 | $3,285 | $114,746 | $28,917 | $85,829 |
| 2017 | $2,724 | $93,197 | $21,263 | $71,934 |
| 2016 | $2,653 | $90,768 | $17,010 | $73,758 |
| 2015 | $2,226 | $80,150 | $11,694 | $68,456 |
| 2014 | $2,226 | $71,146 | $11,694 | $59,452 |
Source: Public Records
Map
Nearby Homes
- 15122 Sheffield Terrace
- 1034 Littleport Ln
- 827 Dondell St
- 1102 Heathfield Dr
- 1123 Maclesby Ln
- 727 Doncrest St
- 730 Doncrest St
- 814 Deercrest St
- 909 Pennygent Ln
- 726 Brookview St
- 707 Doncrest St
- 15014 Groveshire St
- 830 Stonyridge St
- 730 Stonyridge St
- 14951 Scotter Dr
- 826 Ivy Hollow St
- 707 Terryhollow St
- 1323 Padstow Ln
- 14918 Silver Green Dr S
- 1343 Littleport Ln
- 932 Pennygent Ln
- 936 Pennygent Ln
- 930 Pennygent Ln
- 938 Pennygent Ln
- 915 Holbech Ln
- 913 Holbech Ln
- 917 Holbech Ln
- 911 Holbech Ln
- 928 Pennygent Ln
- 909 Holbech Ln
- 919 Holbech Ln
- 907 Holbech Ln
- 926 Pennygent Ln
- 935 Pennygent Ln
- 937 Pennygent Ln
- 933 Pennygent Ln
- 939 Pennygent Ln
- 931 Pennygent Ln
- 923 Holbech Ln
- 924 Pennygent Ln