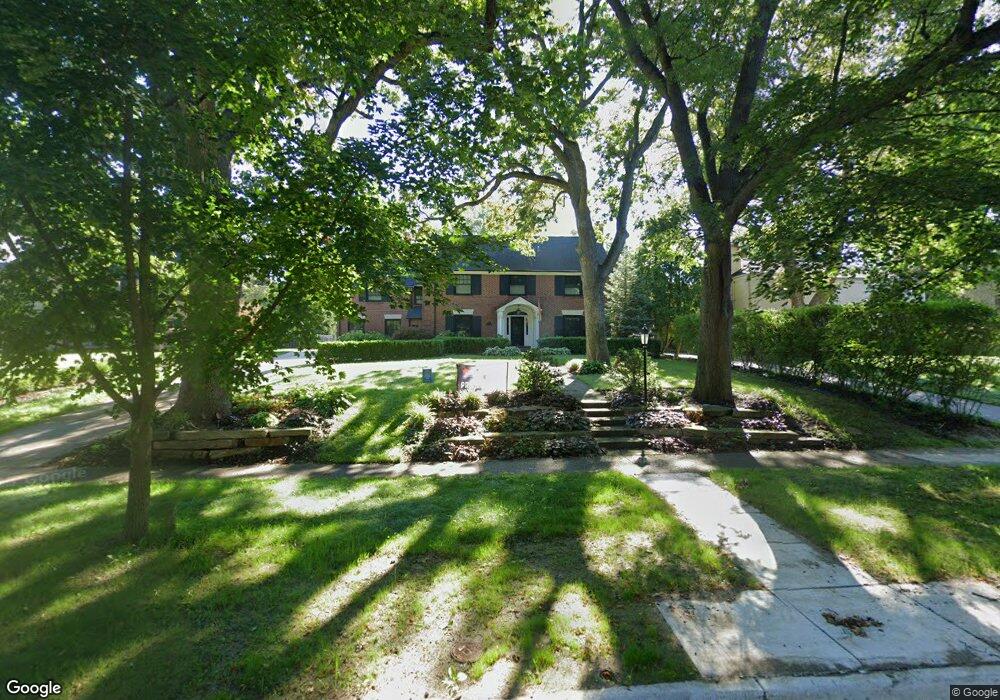
934 Plymouth Ave SE Grand Rapids, MI 49506
Estimated Value: $1,741,000 - $2,108,847
5
Beds
7
Baths
5,858
Sq Ft
$333/Sq Ft
Est. Value
About This Home
This home is located at 934 Plymouth Ave SE, Grand Rapids, MI 49506 and is currently estimated at $1,953,616, approximately $333 per square foot. 934 Plymouth Ave SE is a home located in Kent County with nearby schools including East Grand Rapids High School, St. Stephen School, and Grand Rapids Christian School - Iroquois.
Ownership History
Date
Name
Owned For
Owner Type
Purchase Details
Closed on
Jul 12, 2013
Sold by
Pease Patricia A
Bought by
Engbers David W and Engbers Amy L
Current Estimated Value
Home Financials for this Owner
Home Financials are based on the most recent Mortgage that was taken out on this home.
Original Mortgage
$417,000
Outstanding Balance
$99,099
Interest Rate
4.02%
Mortgage Type
New Conventional
Estimated Equity
$1,854,517
Purchase Details
Closed on
Jun 17, 2011
Sold by
Pease Patricia A
Bought by
Pease Patricia A and The Patricia A Pease Trust
Purchase Details
Closed on
Mar 21, 2011
Sold by
Pease Rodney D and Pease Rodney
Bought by
Pease Patricia A
Purchase Details
Closed on
Mar 23, 2004
Sold by
Pease Rodney Douglas and Pease Patricia Ann
Bought by
Pease Rodney D and Pease Patricia A
Purchase Details
Closed on
Sep 30, 1998
Bought by
Pease Rodney and Engbers David W
Purchase Details
Closed on
Jul 1, 1989
Bought by
Pease Rodney D Trust and Engbers David W
Create a Home Valuation Report for This Property
The Home Valuation Report is an in-depth analysis detailing your home's value as well as a comparison with similar homes in the area
Home Values in the Area
Average Home Value in this Area
Purchase History
| Date | Buyer | Sale Price | Title Company |
|---|---|---|---|
| Engbers David W | -- | First American Title Ins Co | |
| Pease Patricia A | -- | None Available | |
| Pease Patricia A | -- | None Available | |
| Pease Rodney D | -- | -- | |
| Pease Rodney | -- | -- | |
| Pease Rodney D Trust | $375,000 | -- |
Source: Public Records
Mortgage History
| Date | Status | Borrower | Loan Amount |
|---|---|---|---|
| Open | Engbers David W | $417,000 |
Source: Public Records
Tax History Compared to Growth
Tax History
| Year | Tax Paid | Tax Assessment Tax Assessment Total Assessment is a certain percentage of the fair market value that is determined by local assessors to be the total taxable value of land and additions on the property. | Land | Improvement |
|---|---|---|---|---|
| 2025 | $28,721 | $1,046,300 | $0 | $0 |
| 2024 | $28,721 | $935,000 | $0 | $0 |
| 2023 | $29,528 | $813,400 | $0 | $0 |
| 2022 | $27,986 | $765,900 | $0 | $0 |
| 2021 | $27,275 | $729,400 | $0 | $0 |
| 2020 | $25,382 | $736,600 | $0 | $0 |
| 2019 | $26,419 | $770,500 | $0 | $0 |
| 2018 | $26,419 | $713,200 | $0 | $0 |
| 2017 | $25,993 | $630,500 | $0 | $0 |
| 2016 | $25,447 | $459,000 | $0 | $0 |
| 2015 | -- | $459,000 | $0 | $0 |
| 2013 | -- | $316,200 | $0 | $0 |
Source: Public Records
Map
Nearby Homes
- 926 Cambridge Dr SE
- 1048 Plymouth Ave SE
- 1995 San Lu Rae Dr SE
- 1052 Santa Cruz Dr SE
- 833 Gladstone Dr SE
- 1565 Alexander St SE
- 828 Cadillac Dr SE
- 1211 Plymouth Ave SE
- 715 Gladstone Dr SE
- 1043 Floral Ave SE
- 910 Floral Ave SE
- 656 Gladstone Dr SE
- 1813 Kreiser St SE
- 638 Gladstone Dr SE
- 1028 Pinecrest Ave SE
- 859 Orchard Ave SE
- 2350 Elinor Ln SE Unit 7E
- 2350 Elinor Ln SE Unit Lot 7
- 2359 Elinor Ln SE
- 1357 Alexander St SE
- 942 Plymouth Ave SE
- 922 Plymouth Ave SE
- 910 Plymouth Ave SE
- 952 Plymouth Ave SE
- 935 Santa Barbara Dr SE
- 925 Santa Barbara Dr SE
- 943 Santa Barbara Dr SE
- 939 Plymouth Ave SE
- 925 Plymouth Ave SE
- 915 Santa Barbara Dr SE
- 945 Plymouth Ave SE
- 904 Plymouth Ave SE
- 915 Plymouth Ave SE
- 959 Santa Barbara Dr SE
- 966 Plymouth Ave SE
- 909 Plymouth Ave SE
- 909 Santa Barbara Dr SE
- 955 Plymouth Ave SE
- 965 Santa Barbara Dr SE
- 972 Plymouth Ave SE