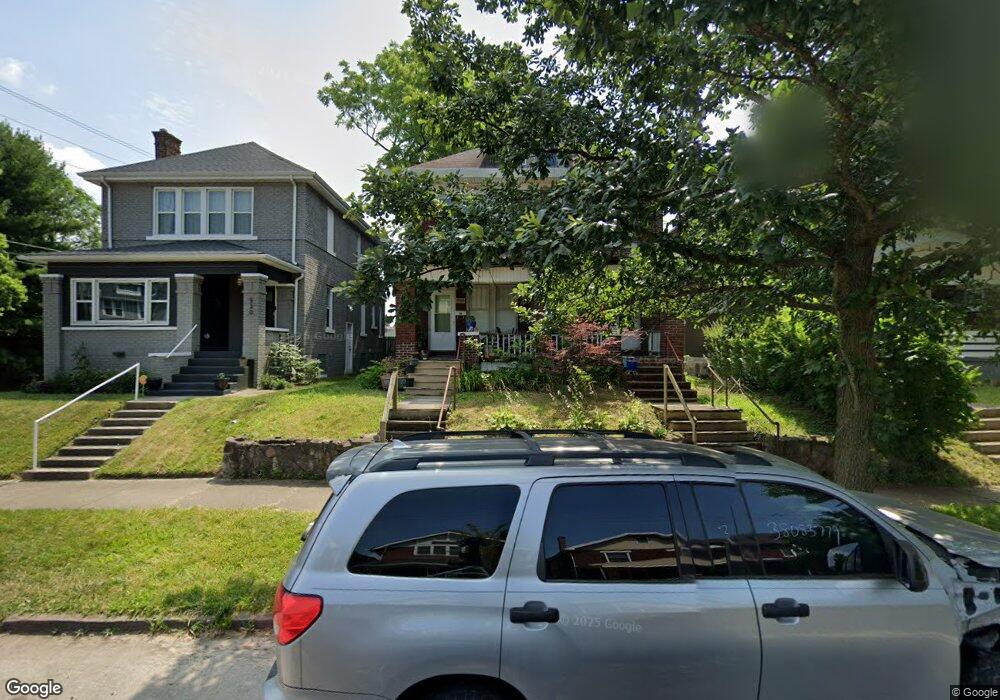
934 S Ohio Ave Unit 936 Columbus, OH 43206
Southern Orchards NeighborhoodEstimated Value: $267,000 - $386,000
6
Beds
2
Baths
2,520
Sq Ft
$122/Sq Ft
Est. Value
About This Home
This home is located at 934 S Ohio Ave Unit 936, Columbus, OH 43206 and is currently estimated at $308,128, approximately $122 per square foot. 934 S Ohio Ave Unit 936 is a home located in Franklin County with nearby schools including Livingston Elementary School, South High School, and Capital Collegiate Preparatory Academy.
Ownership History
Date
Name
Owned For
Owner Type
Purchase Details
Closed on
Nov 28, 2011
Sold by
Barnes Michael
Bought by
Jimenez Ronald
Current Estimated Value
Purchase Details
Closed on
Jun 12, 2006
Sold by
Jenkins Henry L and Jenkins Donna L
Bought by
Jiminez Ronald and Barnes Michael
Home Financials for this Owner
Home Financials are based on the most recent Mortgage that was taken out on this home.
Original Mortgage
$108,300
Interest Rate
6.72%
Mortgage Type
FHA
Purchase Details
Closed on
May 26, 2004
Sold by
Swilley Graylyn M and Woods Gregory D
Bought by
Jenkins Henry L and Jenkins Donna L
Home Financials for this Owner
Home Financials are based on the most recent Mortgage that was taken out on this home.
Original Mortgage
$60,000
Interest Rate
6.06%
Mortgage Type
Purchase Money Mortgage
Purchase Details
Closed on
Mar 13, 1979
Bought by
Swilley Graylyn M
Create a Home Valuation Report for This Property
The Home Valuation Report is an in-depth analysis detailing your home's value as well as a comparison with similar homes in the area
Home Values in the Area
Average Home Value in this Area
Purchase History
| Date | Buyer | Sale Price | Title Company |
|---|---|---|---|
| Jimenez Ronald | $45,000 | None Available | |
| Jiminez Ronald | $110,000 | Supreme Tit | |
| Jenkins Henry L | $75,000 | Amerititle | |
| Swilley Graylyn M | -- | -- |
Source: Public Records
Mortgage History
| Date | Status | Borrower | Loan Amount |
|---|---|---|---|
| Previous Owner | Jiminez Ronald | $108,300 | |
| Previous Owner | Jenkins Henry L | $60,000 |
Source: Public Records
Tax History Compared to Growth
Tax History
| Year | Tax Paid | Tax Assessment Tax Assessment Total Assessment is a certain percentage of the fair market value that is determined by local assessors to be the total taxable value of land and additions on the property. | Land | Improvement |
|---|---|---|---|---|
| 2024 | $3,799 | $83,760 | $31,330 | $52,430 |
| 2023 | $3,901 | $83,755 | $31,325 | $52,430 |
| 2022 | $2,168 | $38,430 | $6,580 | $31,850 |
| 2021 | $2,171 | $38,430 | $6,580 | $31,850 |
| 2020 | $2,174 | $38,430 | $6,580 | $31,850 |
| 2019 | $1,817 | $29,580 | $5,080 | $24,500 |
| 2018 | $1,849 | $29,580 | $5,080 | $24,500 |
| 2017 | $1,866 | $29,580 | $5,080 | $24,500 |
| 2016 | $2,067 | $30,070 | $4,480 | $25,590 |
| 2015 | $1,884 | $30,070 | $4,480 | $25,590 |
| 2014 | $1,839 | $30,070 | $4,480 | $25,590 |
| 2013 | $954 | $31,640 | $4,725 | $26,915 |
Source: Public Records
Map
Nearby Homes
- 943 S Champion Ave
- 918 S Ohio Ave
- 931 S Ohio Ave
- 935 S Ohio Ave
- 993 Oakwood Ave
- 856 S Ohio Ave
- 900-902 Oakwood Ave
- 887-891 S 22nd St
- 867 S 22nd St
- 946 Wilson Ave
- 1045 Wilson Ave Unit 47
- 883 E Whittier St
- 786 S Ohio Ave
- 1096 E Sycamore St
- 791-793 S Champion Ave
- 981 Gilbert St
- 1107 Stanley Ave
- 831 Wilson Ave
- 911 Linwood Ave Unit & 913
- 1100 Wilson Ave Unit 1100
- 934-936 S Ohio Ave
- 940 S Ohio Ave
- 930 S Ohio Ave
- 944 S Ohio Ave
- 946 S Ohio Ave Unit 950
- 948 S Ohio Ave
- 954 S Ohio Ave Unit C
- 954 S Ohio Ave Unit D
- 954 S Ohio Ave
- 912 S Ohio Ave Unit 914
- 958 S Ohio Ave
- 939 S Champion Ave
- 951 S Champion Ave
- 955 S Champion Ave
- 960 S Ohio Ave Unit 962
- 960-962 S Ohio Ave
- 908 S Ohio Ave
- 927 S Ohio Ave
- 925 S Champion Ave Unit 927
- 941 S Ohio Ave