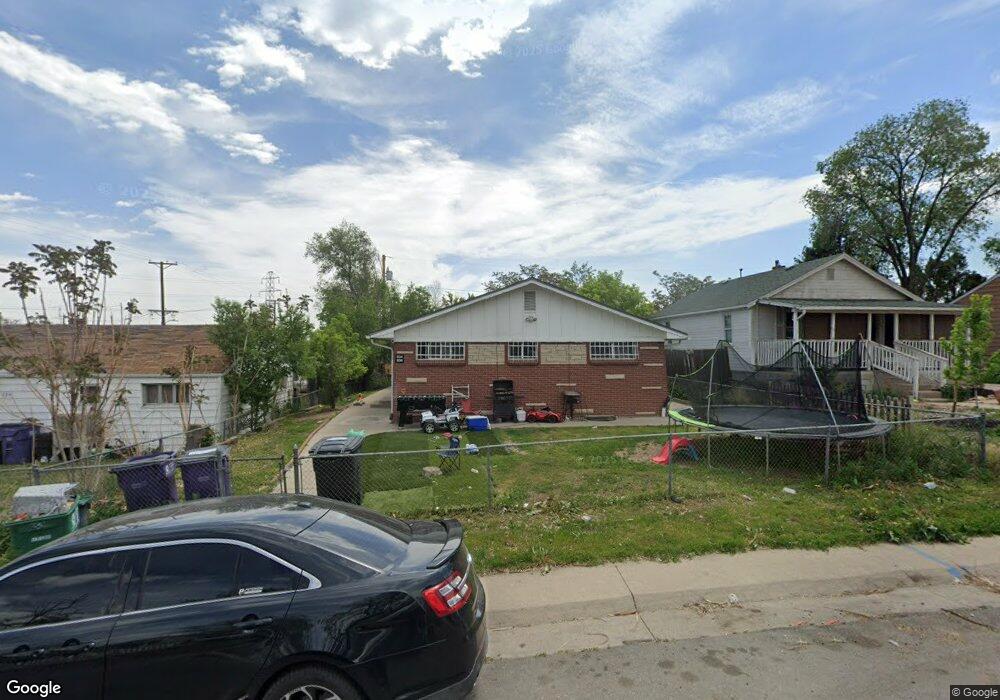
934 S Quitman St Denver, CO 80219
Westwood NeighborhoodEstimated Value: $395,899 - $554,000
6
Beds
2
Baths
3,260
Sq Ft
$146/Sq Ft
Est. Value
About This Home
This home is located at 934 S Quitman St, Denver, CO 80219 and is currently estimated at $474,950, approximately $145 per square foot. 934 S Quitman St is a home located in Denver County with nearby schools including Castro Elementary School, Kepner Beacon Middle School, and West High School.
Ownership History
Date
Name
Owned For
Owner Type
Purchase Details
Closed on
Mar 18, 2009
Sold by
Castorena Arlene
Bought by
Venegas Odilon and Venegas Maria Isabel
Current Estimated Value
Home Financials for this Owner
Home Financials are based on the most recent Mortgage that was taken out on this home.
Original Mortgage
$101,500
Outstanding Balance
$67,995
Interest Rate
6.5%
Mortgage Type
Adjustable Rate Mortgage/ARM
Estimated Equity
$406,955
Purchase Details
Closed on
Aug 22, 2000
Sold by
Ko Anna Wu
Bought by
Castorena Arlene
Home Financials for this Owner
Home Financials are based on the most recent Mortgage that was taken out on this home.
Original Mortgage
$242,329
Interest Rate
8.15%
Mortgage Type
FHA
Purchase Details
Closed on
Jun 20, 1997
Sold by
Troyer Dean R and Troyer Clytice M
Bought by
Ko Ming Shein and Ko Anna Wu
Home Financials for this Owner
Home Financials are based on the most recent Mortgage that was taken out on this home.
Original Mortgage
$86,597
Interest Rate
11.25%
Mortgage Type
Purchase Money Mortgage
Create a Home Valuation Report for This Property
The Home Valuation Report is an in-depth analysis detailing your home's value as well as a comparison with similar homes in the area
Home Values in the Area
Average Home Value in this Area
Purchase History
| Date | Buyer | Sale Price | Title Company |
|---|---|---|---|
| Venegas Odilon | $145,000 | None Available | |
| Castorena Arlene | $243,950 | -- | |
| Ko Ming Shein | $112,000 | -- |
Source: Public Records
Mortgage History
| Date | Status | Borrower | Loan Amount |
|---|---|---|---|
| Open | Venegas Odilon | $101,500 | |
| Previous Owner | Castorena Arlene | $242,329 | |
| Previous Owner | Ko Ming Shein | $86,597 |
Source: Public Records
Tax History
| Year | Tax Paid | Tax Assessment Tax Assessment Total Assessment is a certain percentage of the fair market value that is determined by local assessors to be the total taxable value of land and additions on the property. | Land | Improvement |
|---|---|---|---|---|
| 2025 | $2,839 | $32,780 | $10,270 | $10,270 |
| 2024 | $2,839 | $35,840 | $4,380 | $31,460 |
| 2023 | $2,777 | $35,840 | $4,380 | $31,460 |
| 2022 | $2,115 | $26,600 | $7,970 | $18,630 |
| 2021 | $2,087 | $27,970 | $8,380 | $19,590 |
| 2020 | $1,715 | $23,110 | $6,340 | $16,770 |
| 2019 | $1,667 | $23,110 | $6,340 | $16,770 |
| 2018 | $1,606 | $20,760 | $4,570 | $16,190 |
| 2017 | $1,601 | $20,760 | $4,570 | $16,190 |
| 2016 | $1,198 | $14,690 | $4,290 | $10,400 |
| 2015 | $1,148 | $14,690 | $4,290 | $10,400 |
| 2014 | $939 | $11,310 | $2,523 | $8,787 |
Source: Public Records
Map
Nearby Homes
- 1037 S Perry St
- 1050 S Quitman St
- 1060 S Perry St
- 971 S Tennyson St
- 1110 S Quitman St
- 4450 W Kentucky Ave
- 4445 W Tennessee Ave
- 1026 S Newton St
- 3936 W Walsh Place Unit 8
- 695 S Newton St
- 950 S Wolff St
- 971 S Wolff St
- 1165 S Winona Ct
- 3457 W Hoye Place
- 3490 W Exposition Ave
- 3580 W Arizona Ave
- 1145 S Wolff St
- 580 S Quitman St
- 550 S Raleigh St
- 990 S Meade St
- 924 S Quitman St
- 944 S Quitman St
- 948 S Quitman St
- 956 S Quitman St
- 923 S Quitman St
- 937 S Perry St
- 4060 W Kentucky Ave
- 900 S Quitman St Unit 908
- 941 S Quitman St
- 4024 W Kentucky Ave
- 4054 W Kentucky Ave
- 919 S Quitman St
- 960 Quitman St
- 943 S Quitman St
- 925 S Quitman St
- 957 S Perry St
- 4102 W Kentucky Ave
- 921 S Quitman St
- 4000 W Kentucky Ave
- 969 S Quitman St
Your Personal Tour Guide
Ask me questions while you tour the home.