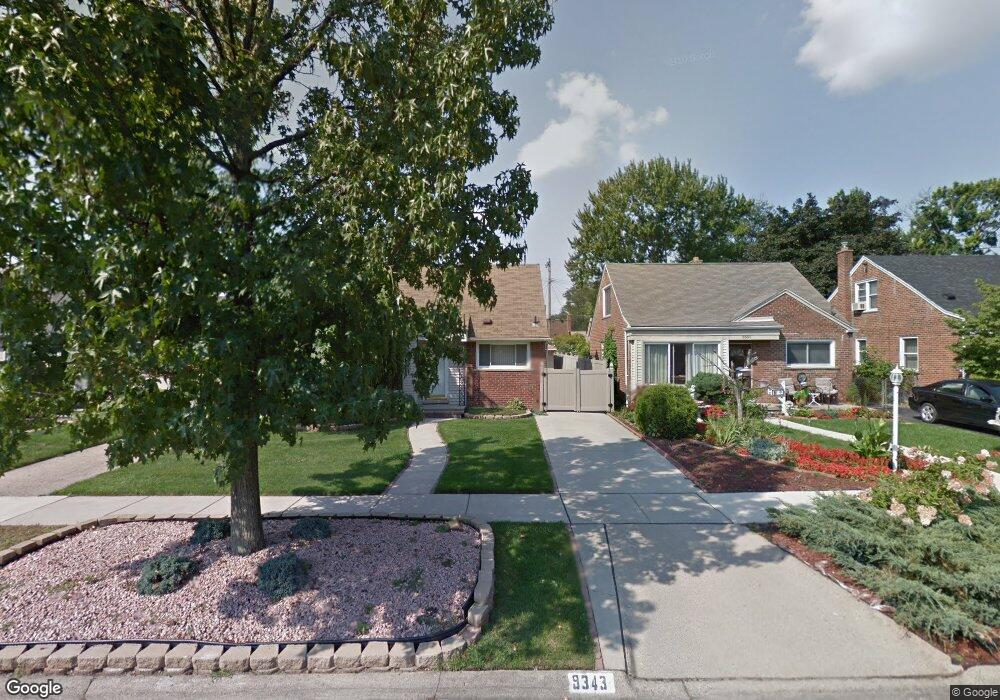
9343 Dixie Redford, MI 48239
Estimated Value: $157,970 - $209,000
3
Beds
1
Bath
1,280
Sq Ft
$147/Sq Ft
Est. Value
About This Home
This home is located at 9343 Dixie, Redford, MI 48239 and is currently estimated at $188,743, approximately $147 per square foot. 9343 Dixie is a home located in Wayne County with nearby schools including John D. Pierce Middle School, Lee M. Thurston High School, and Global Heights Academy.
Ownership History
Date
Name
Owned For
Owner Type
Purchase Details
Closed on
Apr 27, 2010
Sold by
Haria Snehal
Bought by
Angel Solutions Llc
Current Estimated Value
Purchase Details
Closed on
May 14, 2009
Sold by
Investor Helpers Llc
Bought by
Haria Snehal
Purchase Details
Closed on
May 9, 2008
Sold by
Mortgage Electronic Registration Systems
Bought by
Wells Fargo Bank Na and Securitized Asset Backed Receivables Llc
Purchase Details
Closed on
Apr 2, 2008
Sold by
Falloni Kimberly J
Bought by
Mortgage Electronic Registration Systems
Purchase Details
Closed on
Jul 25, 2005
Sold by
Falloni David J and Falloni Kimberly
Bought by
Falloni Kimberly
Create a Home Valuation Report for This Property
The Home Valuation Report is an in-depth analysis detailing your home's value as well as a comparison with similar homes in the area
Home Values in the Area
Average Home Value in this Area
Purchase History
| Date | Buyer | Sale Price | Title Company |
|---|---|---|---|
| Angel Solutions Llc | -- | None Available | |
| Haria Snehal | $39,000 | Embassy Title Agency Inc | |
| Wells Fargo Bank Na | -- | None Available | |
| Mortgage Electronic Registration Systems | $138,294 | None Available | |
| Falloni Kimberly | -- | Michigan Title Agency Inc |
Source: Public Records
Tax History Compared to Growth
Tax History
| Year | Tax Paid | Tax Assessment Tax Assessment Total Assessment is a certain percentage of the fair market value that is determined by local assessors to be the total taxable value of land and additions on the property. | Land | Improvement |
|---|---|---|---|---|
| 2025 | $1,195 | $65,300 | $0 | $0 |
| 2024 | $1,195 | $60,000 | $0 | $0 |
| 2023 | $1,144 | $51,300 | $0 | $0 |
| 2022 | $1,577 | $43,400 | $0 | $0 |
| 2021 | $1,919 | $40,400 | $0 | $0 |
| 2020 | $1,894 | $36,700 | $0 | $0 |
| 2019 | $1,856 | $32,000 | $0 | $0 |
| 2018 | $648 | $28,100 | $0 | $0 |
| 2017 | $1,966 | $26,000 | $0 | $0 |
| 2016 | $1,608 | $26,800 | $0 | $0 |
| 2015 | $1,951 | $25,000 | $0 | $0 |
| 2013 | $1,890 | $19,300 | $0 | $0 |
| 2012 | $2,284 | $29,700 | $6,500 | $23,200 |
Source: Public Records
Map
Nearby Homes