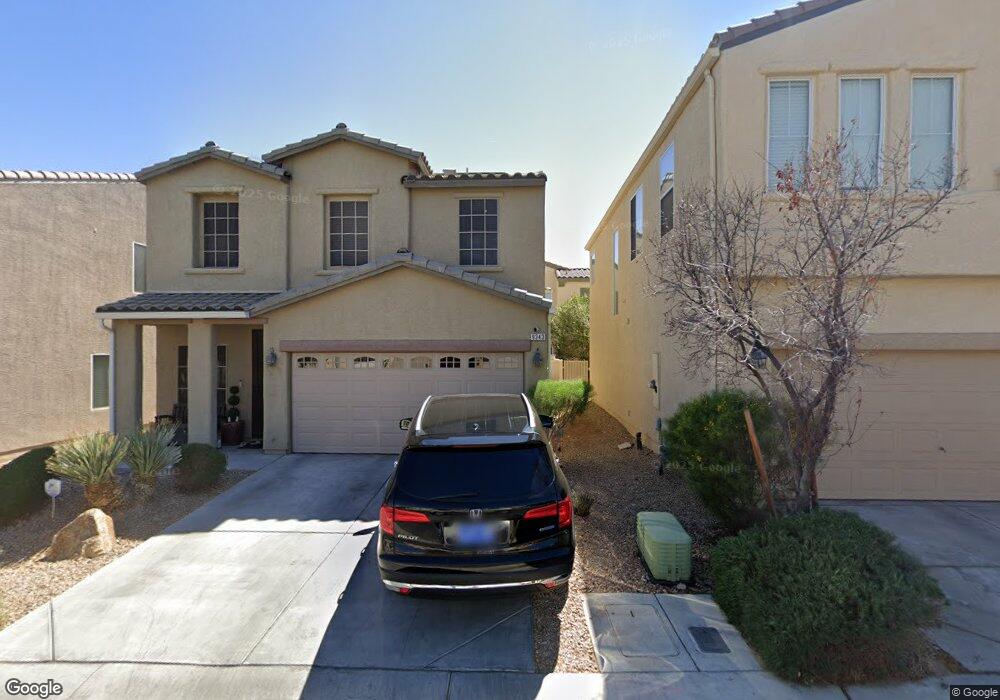
9343 Fitzwilliam Ave Las Vegas, NV 89178
Mountains Edge NeighborhoodEstimated Value: $419,000 - $430,000
4
Beds
3
Baths
1,715
Sq Ft
$247/Sq Ft
Est. Value
About This Home
This home is located at 9343 Fitzwilliam Ave, Las Vegas, NV 89178 and is currently estimated at $423,684, approximately $247 per square foot. 9343 Fitzwilliam Ave is a home located in Clark County with nearby schools including William V. Wright Elementary School, Sierra Vista High School, and Doral Academy Cactus.
Ownership History
Date
Name
Owned For
Owner Type
Purchase Details
Closed on
Jul 29, 2011
Sold by
Federal National Mortgage Association
Bought by
Lopez Normelinda H
Current Estimated Value
Home Financials for this Owner
Home Financials are based on the most recent Mortgage that was taken out on this home.
Original Mortgage
$118,907
Outstanding Balance
$83,017
Interest Rate
4.75%
Mortgage Type
FHA
Estimated Equity
$340,667
Purchase Details
Closed on
Jul 28, 2011
Sold by
Lopez Sandy Gil Torres
Bought by
Lopez Normelinda H
Home Financials for this Owner
Home Financials are based on the most recent Mortgage that was taken out on this home.
Original Mortgage
$118,907
Outstanding Balance
$83,017
Interest Rate
4.75%
Mortgage Type
FHA
Estimated Equity
$340,667
Purchase Details
Closed on
Apr 7, 2011
Sold by
Engdasew Nunu
Bought by
Federal National Mortgage Association
Purchase Details
Closed on
Jun 22, 2006
Sold by
Richmond American Homes Of Nevada Inc
Bought by
Engdasew Nunu
Home Financials for this Owner
Home Financials are based on the most recent Mortgage that was taken out on this home.
Original Mortgage
$249,021
Interest Rate
6.55%
Mortgage Type
Unknown
Create a Home Valuation Report for This Property
The Home Valuation Report is an in-depth analysis detailing your home's value as well as a comparison with similar homes in the area
Home Values in the Area
Average Home Value in this Area
Purchase History
| Date | Buyer | Sale Price | Title Company |
|---|---|---|---|
| Lopez Normelinda H | $122,000 | Servicelink Irvine | |
| Lopez Normelinda H | -- | Servicelink Irvine | |
| Federal National Mortgage Association | $261,786 | Lsi Title Agency Inc | |
| Engdasew Nunu | $311,277 | Stewart Title Of Nevada |
Source: Public Records
Mortgage History
| Date | Status | Borrower | Loan Amount |
|---|---|---|---|
| Open | Lopez Normelinda H | $118,907 | |
| Previous Owner | Engdasew Nunu | $249,021 |
Source: Public Records
Tax History Compared to Growth
Tax History
| Year | Tax Paid | Tax Assessment Tax Assessment Total Assessment is a certain percentage of the fair market value that is determined by local assessors to be the total taxable value of land and additions on the property. | Land | Improvement |
|---|---|---|---|---|
| 2025 | $2,119 | $109,426 | $33,250 | $76,176 |
| 2024 | $1,962 | $109,426 | $33,250 | $76,176 |
| 2023 | $1,962 | $103,052 | $31,500 | $71,552 |
| 2022 | $1,817 | $91,711 | $26,250 | $65,461 |
| 2021 | $1,682 | $86,637 | $24,500 | $62,137 |
| 2020 | $1,559 | $85,910 | $24,500 | $61,410 |
| 2019 | $1,461 | $80,585 | $20,300 | $60,285 |
| 2018 | $1,394 | $73,844 | $16,100 | $57,744 |
| 2017 | $1,971 | $67,189 | $15,050 | $52,139 |
| 2016 | $1,390 | $60,557 | $11,900 | $48,657 |
| 2015 | $1,255 | $54,756 | $9,100 | $45,656 |
| 2014 | $1,216 | $40,323 | $4,900 | $35,423 |
Source: Public Records
Map
Nearby Homes
- 9745 Wickstead St
- 9723 Rocket Grove Ct
- 9713 Rocket Grove Ct
- 9722 Rocket Grove Ct
- 9822 Opal Bridge Ct
- 9339 Desert Heat Ave
- 9690 Langden Brook St
- 9869 Juno Hills St
- 9264 Valley Ranch Ave
- 9825 Emerald Twilight St
- 9526 Summer Furnace St
- 9806 Emerald Twilight St
- 9250 Wild Stampede Ave
- 9509 Summer Furnace St
- 9162 Weeping Hollow Ave
- 9141 Castle Valley Ave
- 9395 Fort Bayard Ave
- 9665 Durham Ranch St
- 9076 Bridal Creek Ave
- 9091 Jumping Jacks Ave
- 9349 Fitzwilliam Ave
- 9349 Fitzwilliam Ave Unit na
- 9354 Cowboy Rain Dr
- 9348 Cowboy Rain Dr
- 9355 Fitzwilliam Ave
- 9331 Fitzwilliam Ave
- 9360 Cowboy Rain Dr
- 9342 Cowboy Rain Dr
- 9342 Fitzwilliam Ave
- 9361 Fitzwilliam Ave
- 9325 Fitzwilliam Ave
- 9336 Fitzwilliam Ave
- 9348 Fitzwilliam Ave
- 9366 Cowboy Rain Dr
- 9330 Fitzwilliam Ave
- 9330 Fitzwilliam Ave
- 9336 Cowboy Rain Dr
- 9354 Fitzwilliam Ave
- 9324 Fitzwilliam Ave