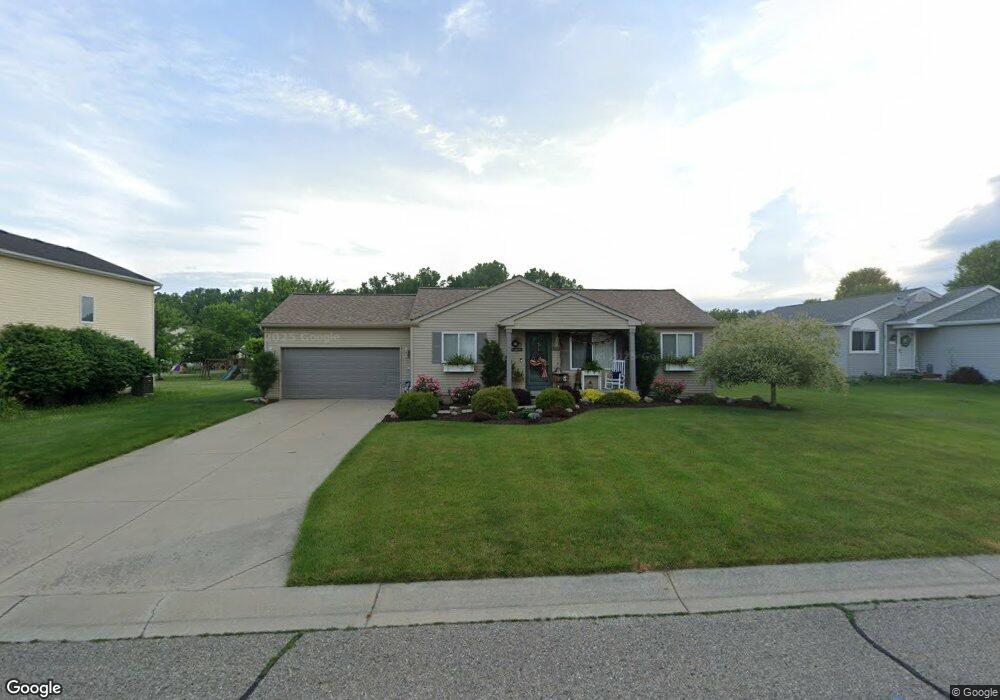
9343 Sandy Hollow Ln Unit 94 Davison, MI 48423
Estimated Value: $239,000 - $258,000
3
Beds
2
Baths
1,080
Sq Ft
$228/Sq Ft
Est. Value
About This Home
This home is located at 9343 Sandy Hollow Ln Unit 94, Davison, MI 48423 and is currently estimated at $246,528, approximately $228 per square foot. 9343 Sandy Hollow Ln Unit 94 is a home located in Genesee County with nearby schools including Thomson Elementary School, Siple Elementary School, and Hill Elementary School.
Ownership History
Date
Name
Owned For
Owner Type
Purchase Details
Closed on
Mar 2, 2011
Sold by
Demars William N
Bought by
Marsh Julie K
Current Estimated Value
Purchase Details
Closed on
Nov 18, 2009
Sold by
Wood Robert D and Wood Debra L
Bought by
Citibank Na
Purchase Details
Closed on
Sep 27, 2005
Sold by
Stockemer Peter S and Stockemer Kim
Bought by
Wood Robert D and Wood Debra L
Home Financials for this Owner
Home Financials are based on the most recent Mortgage that was taken out on this home.
Original Mortgage
$126,350
Interest Rate
8.62%
Mortgage Type
Stand Alone First
Purchase Details
Closed on
Nov 6, 2002
Sold by
Locke Mary
Bought by
Stockemer Peter S
Create a Home Valuation Report for This Property
The Home Valuation Report is an in-depth analysis detailing your home's value as well as a comparison with similar homes in the area
Home Values in the Area
Average Home Value in this Area
Purchase History
| Date | Buyer | Sale Price | Title Company |
|---|---|---|---|
| Marsh Julie K | $95,000 | Sargents Title Compay | |
| Citibank Na | $72,000 | None Available | |
| Wood Robert D | $140,400 | Garrow Title Agency | |
| Stockemer Peter S | $30,000 | Lawyers Title |
Source: Public Records
Mortgage History
| Date | Status | Borrower | Loan Amount |
|---|---|---|---|
| Previous Owner | Wood Robert D | $126,350 |
Source: Public Records
Tax History Compared to Growth
Tax History
| Year | Tax Paid | Tax Assessment Tax Assessment Total Assessment is a certain percentage of the fair market value that is determined by local assessors to be the total taxable value of land and additions on the property. | Land | Improvement |
|---|---|---|---|---|
| 2025 | $2,211 | $112,600 | $0 | $0 |
| 2024 | $596 | $103,000 | $0 | $0 |
| 2023 | $569 | $100,200 | $0 | $0 |
| 2022 | $1,928 | $80,200 | $0 | $0 |
| 2021 | $1,912 | $73,600 | $0 | $0 |
| 2020 | $520 | $70,600 | $0 | $0 |
| 2019 | $512 | $69,700 | $0 | $0 |
| 2018 | $1,126 | $66,600 | $0 | $0 |
| 2017 | $1,645 | $66,600 | $0 | $0 |
| 2016 | $1,555 | $63,000 | $0 | $0 |
| 2015 | $1,224 | $55,500 | $0 | $0 |
| 2014 | $472 | $50,100 | $0 | $0 |
| 2012 | -- | $36,400 | $36,400 | $0 |
Source: Public Records
Map
Nearby Homes
- 9475 Sandy Hollow Ln Unit 109
- 5238 N Gale Rd
- 9508 Orchard Lake Dr
- 9520 Orchard Lake Dr
- 6096 N Gale Rd
- 255 Roosevelt Dr
- 6152 N Gale Rd
- 4078 N State Rd
- 9805 E Richfield Rd
- 4063 N Gale Rd
- 5346 N Oak Rd
- 9377 Hubbard Rd
- 4438 N Oak Rd
- 9413 Blue Spruce Ct Unit 54
- 3372 Spruceridge Ct Unit 82
- 3365 Spruceridge Ct Unit 78
- 3369 Meadow Ridge Ct
- 3367 Meadow Ridge Ct
- 1240 N Irish Rd
- 5105 N Irish Rd
- 9351 Sandy Hollow Ln Unit 95
- 9342 Tiger Run Trail Unit 81
- 9359 Sandy Hollow Ln Unit 96
- 9327 Sandy Hollow Ln Unit 92
- 9334 Tiger Run Trail Unit 82
- 9350 Tiger Run Trail Unit 80
- 9326 Tiger Run Trail Unit 83
- 9358 Tiger Run Trail Unit 79
- 9344 Sandy Hollow Ln Unit 43
- 9367 Sandy Hollow Ln Unit 97
- 9336 Sandy Hollow Ln Unit 42
- 9319 Sandy Hollow Ln Unit 91
- 9360 Sandy Hollow Ln Unit 45
- 9328 Sandy Hollow Ln Unit 41
- 9318 Tiger Run Trail Unit 84
- 9366 Tiger Run Trail Unit 78
- 9375 Sandy Hollow Ln Unit 98
- 9368 Sandy Hollow Ln Unit 46
- 9320 Sandy Hollow Ln Unit 40
- 9310 Tiger Run Trail Unit 85