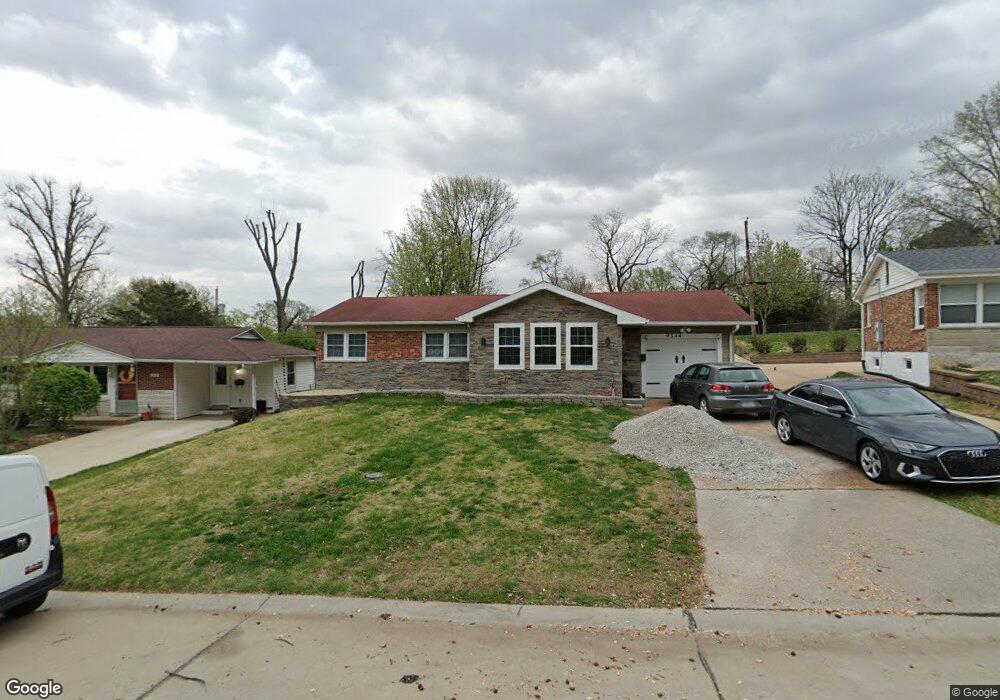
9344 Forman Rd Saint Louis, MO 63123
Lemay NeighborhoodEstimated Value: $210,000 - $260,000
3
Beds
2
Baths
1,160
Sq Ft
$201/Sq Ft
Est. Value
About This Home
This home is located at 9344 Forman Rd, Saint Louis, MO 63123 and is currently estimated at $233,264, approximately $201 per square foot. 9344 Forman Rd is a home located in St. Louis County with nearby schools including Bayless Elementary School, Bayless Junior High School, and Bayless Senior High School.
Ownership History
Date
Name
Owned For
Owner Type
Purchase Details
Closed on
Apr 10, 2020
Sold by
Varnica Hidajet and Varnica Senaida
Bought by
Varnica Hidajet and Varnica Senaida
Current Estimated Value
Home Financials for this Owner
Home Financials are based on the most recent Mortgage that was taken out on this home.
Original Mortgage
$111,500
Outstanding Balance
$55,953
Interest Rate
3.5%
Mortgage Type
New Conventional
Estimated Equity
$177,311
Purchase Details
Closed on
Sep 29, 2005
Sold by
Tebbe Gale E
Bought by
Varnica Hidajet and Varnica Zulfija
Home Financials for this Owner
Home Financials are based on the most recent Mortgage that was taken out on this home.
Original Mortgage
$145,847
Interest Rate
5.73%
Mortgage Type
FHA
Purchase Details
Closed on
Sep 21, 2004
Sold by
Tebbe Gale E
Bought by
Tebbe Gale E and Gale E Tebbe Revocable Living Trust
Create a Home Valuation Report for This Property
The Home Valuation Report is an in-depth analysis detailing your home's value as well as a comparison with similar homes in the area
Home Values in the Area
Average Home Value in this Area
Purchase History
| Date | Buyer | Sale Price | Title Company |
|---|---|---|---|
| Varnica Hidajet | -- | Touchstone Title & Abstract | |
| Varnica Hidajet | $147,000 | -- | |
| Tebbe Gale E | -- | -- |
Source: Public Records
Mortgage History
| Date | Status | Borrower | Loan Amount |
|---|---|---|---|
| Open | Varnica Hidajet | $111,500 | |
| Closed | Varnica Hidajet | $145,847 |
Source: Public Records
Tax History Compared to Growth
Tax History
| Year | Tax Paid | Tax Assessment Tax Assessment Total Assessment is a certain percentage of the fair market value that is determined by local assessors to be the total taxable value of land and additions on the property. | Land | Improvement |
|---|---|---|---|---|
| 2025 | $2,416 | $40,680 | $12,600 | $28,080 |
| 2024 | $2,416 | $33,170 | $6,780 | $26,390 |
| 2023 | $2,377 | $33,170 | $6,780 | $26,390 |
| 2022 | $2,375 | $28,020 | $7,750 | $20,270 |
| 2021 | $2,150 | $28,020 | $7,750 | $20,270 |
| 2020 | $2,076 | $25,050 | $8,630 | $16,420 |
| 2019 | $2,071 | $25,050 | $8,630 | $16,420 |
| 2018 | $2,139 | $22,960 | $6,710 | $16,250 |
| 2017 | $2,009 | $22,960 | $6,710 | $16,250 |
| 2016 | $1,856 | $20,850 | $4,430 | $16,420 |
| 2015 | $1,865 | $20,850 | $4,430 | $16,420 |
| 2014 | $1,863 | $20,770 | $4,050 | $16,720 |
Source: Public Records
Map
Nearby Homes
- 9038 Kickapoo Dr
- 4415 Cayuga Dr
- 4500 Spring Dr
- 816 Forman Rd
- 9544 Dana Ave
- 8709 Holbrook Dr
- 9430 Dana Ave
- 8911 Kammerer Ave
- 8628 Hillery Dr
- 9606 Dana Ave
- 4409 Fatima Dr
- 8706 Fatima Dr
- 1434 Friar Tuck Ln
- 4248 Kay Ln Unit 9
- 9108 Tiber Ct
- 1520 Union Rd
- 9121 Niger Dr
- 9117 Tiber Ct
- 9804 Allendale Dr
- 9140 Arvin Place
- 9507 Forman Rd
- 9511 Forman Rd
- 9340 Forman Rd
- 9348 Forman Rd
- 9336 Forman Rd
- 9345 Forman Rd
- 4700 Blackhawk Dr
- 9335 Forman Rd
- 0Lot A Blackhawk
- 9025 Turquoise Dr
- 9029 Turquoise Dr
- 9328 Forman Rd
- 4707 Blackhawk Dr
- 4704 Blackhawk Dr
- 9329 Forman Rd
- 4480 Mohegan Dr
- 4456 Turquoise Dr
- 4708 Blackhawk Dr
- 4711 Blackhawk Dr
- 4710 Mohegan Dr