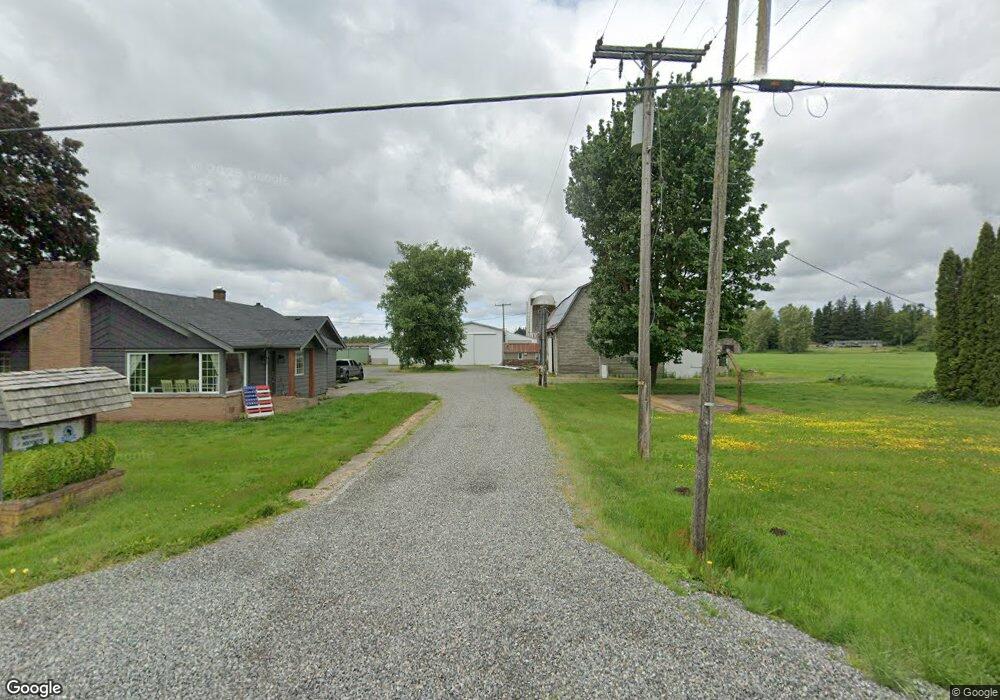
9347 Axling Rd Lynden, WA 98264
Estimated Value: $747,000 - $827,106
6
Beds
3
Baths
2,356
Sq Ft
$334/Sq Ft
Est. Value
About This Home
This home is located at 9347 Axling Rd, Lynden, WA 98264 and is currently estimated at $787,053, approximately $334 per square foot. 9347 Axling Rd is a home located in Whatcom County with nearby schools including Lynden High School and Ebenezer Christian School.
Ownership History
Date
Name
Owned For
Owner Type
Purchase Details
Closed on
Jun 28, 2021
Sold by
Haak Tim Vander and Haak Julie Vander
Bought by
Vander Haak Aric Lee
Current Estimated Value
Home Financials for this Owner
Home Financials are based on the most recent Mortgage that was taken out on this home.
Original Mortgage
$572,000
Outstanding Balance
$519,001
Interest Rate
2.9%
Mortgage Type
New Conventional
Estimated Equity
$268,052
Purchase Details
Closed on
Jan 17, 2008
Sold by
Postma John A and Postma Melissa L
Bought by
Vander Haak Tim and Vander Haak Julie
Home Financials for this Owner
Home Financials are based on the most recent Mortgage that was taken out on this home.
Original Mortgage
$374,000
Interest Rate
6.09%
Mortgage Type
Purchase Money Mortgage
Create a Home Valuation Report for This Property
The Home Valuation Report is an in-depth analysis detailing your home's value as well as a comparison with similar homes in the area
Home Values in the Area
Average Home Value in this Area
Purchase History
| Date | Buyer | Sale Price | Title Company |
|---|---|---|---|
| Vander Haak Aric Lee | $672,561 | Whatcom Land Title | |
| Vander Haak Tim | $440,280 | Chicago Title Insurance |
Source: Public Records
Mortgage History
| Date | Status | Borrower | Loan Amount |
|---|---|---|---|
| Open | Vander Haak Aric Lee | $572,000 | |
| Previous Owner | Vander Haak Tim | $374,000 |
Source: Public Records
Tax History Compared to Growth
Tax History
| Year | Tax Paid | Tax Assessment Tax Assessment Total Assessment is a certain percentage of the fair market value that is determined by local assessors to be the total taxable value of land and additions on the property. | Land | Improvement |
|---|---|---|---|---|
| 2024 | $3,522 | $689,390 | $324,256 | $365,134 |
| 2023 | $3,522 | $517,486 | $92,615 | $424,871 |
| 2022 | $3,270 | $474,763 | $84,969 | $389,794 |
| 2021 | $2,957 | $370,912 | $66,382 | $304,530 |
| 2020 | $2,654 | $271,691 | $22,074 | $249,617 |
| 2019 | $2,565 | $280,201 | $50,148 | $230,053 |
| 2018 | $3,243 | $246,164 | $20,000 | $226,164 |
| 2017 | $2,703 | $257,244 | $24,380 | $232,864 |
| 2016 | $2,638 | $227,699 | $21,580 | $206,119 |
| 2015 | $2,374 | $220,736 | $20,920 | $199,816 |
| 2014 | -- | $219,921 | $24,786 | $195,135 |
| 2013 | -- | $222,608 | $24,893 | $197,715 |
Source: Public Records
Map
Nearby Homes
- 9604 Jackman Rd
- 8951 Weidkamp Rd
- 9837 Guide Meridian Rd
- 9924 Markworth Rd
- 599 Loomis Trail Rd
- 893 Loomis Trail Rd
- 9785 Stillwater Ln
- 602 Redwood Rd
- 1877 Emerald Way
- 2111 Greenview Ln
- 8374 W Meadow Ln
- 1739 Emerald Way
- 872 Sunrise Dr
- 885 Sunrise Dr
- 449 Island Green Way
- 2 Guide Meridian Rd
- 0 Island Green Way
- 424 Island Green Way
- 761 Sunrise Dr
- 605 N Forest Ct