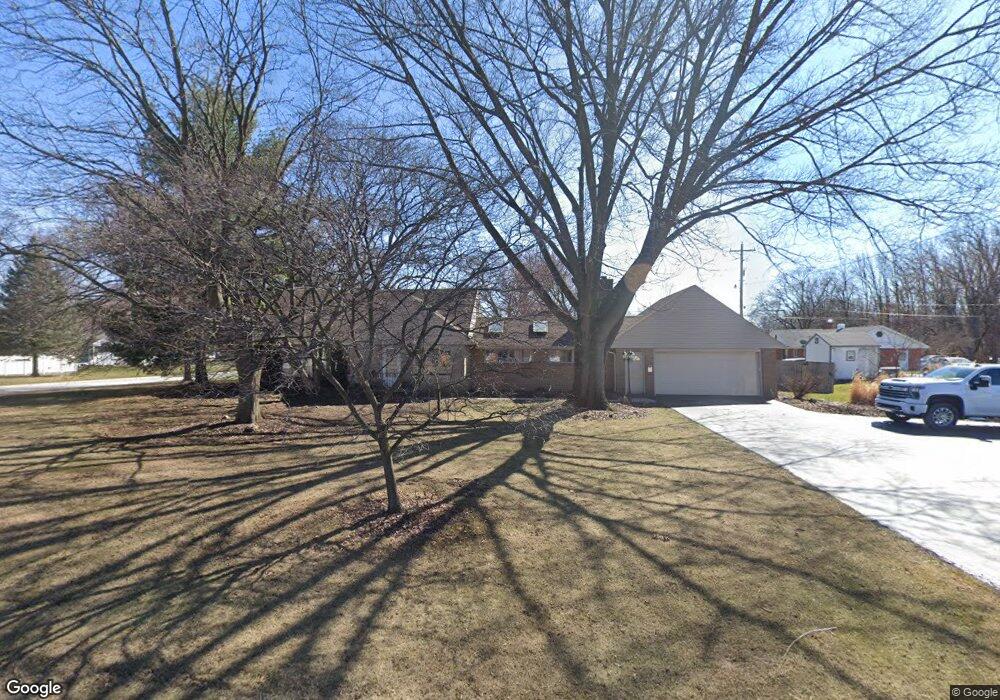
935 6th St Findlay, OH 45840
Estimated Value: $245,000 - $293,656
3
Beds
3
Baths
2,072
Sq Ft
$130/Sq Ft
Est. Value
About This Home
This home is located at 935 6th St, Findlay, OH 45840 and is currently estimated at $268,914, approximately $129 per square foot. 935 6th St is a home located in Hancock County with nearby schools including Jefferson Elementary School, Chamberlin Hill Elementary School, and Donnell Middle School.
Ownership History
Date
Name
Owned For
Owner Type
Purchase Details
Closed on
May 2, 1994
Bought by
Clark Shannon D and Clark Catherine G
Current Estimated Value
Purchase Details
Closed on
Aug 30, 1990
Bought by
Abbott James H and Abbott Ann M
Create a Home Valuation Report for This Property
The Home Valuation Report is an in-depth analysis detailing your home's value as well as a comparison with similar homes in the area
Home Values in the Area
Average Home Value in this Area
Purchase History
| Date | Buyer | Sale Price | Title Company |
|---|---|---|---|
| Clark Shannon D | $119,000 | -- | |
| Abbott James H | -- | -- |
Source: Public Records
Tax History
| Year | Tax Paid | Tax Assessment Tax Assessment Total Assessment is a certain percentage of the fair market value that is determined by local assessors to be the total taxable value of land and additions on the property. | Land | Improvement |
|---|---|---|---|---|
| 2024 | $3,135 | $88,240 | $10,230 | $78,010 |
| 2023 | $3,140 | $88,240 | $10,230 | $78,010 |
| 2022 | $3,129 | $88,240 | $10,230 | $78,010 |
| 2021 | $2,692 | $66,130 | $10,230 | $55,900 |
| 2020 | $2,692 | $66,130 | $10,230 | $55,900 |
| 2019 | $2,637 | $66,130 | $10,230 | $55,900 |
| 2018 | $2,562 | $58,890 | $10,230 | $48,660 |
| 2017 | $1,281 | $58,890 | $10,230 | $48,660 |
| 2016 | $2,522 | $58,890 | $10,230 | $48,660 |
| 2015 | $1,916 | $43,810 | $10,230 | $33,580 |
| 2014 | $1,916 | $43,810 | $10,230 | $33,580 |
| 2012 | $2,334 | $52,970 | $10,230 | $42,740 |
Source: Public Records
Map
Nearby Homes
- 1100 Stall Dr
- 1709 Eastview Dr
- 1726 Eastview Dr
- 731 5th St
- 0 Blanchard Ave
- 1037 Fishlock Ave
- 1200 1st St
- 331 Fairlawn Place
- 315 Fairlawn Place
- 15591 Canadian Way
- 15586 Canadian Way
- 15615 Canadian Way
- 206 Greenlawn Ave
- 123 Glendale Ave
- 216 1st St
- 209 E Hobart Ave
- 242 E Yates Ave
- 136 E Hobart Ave
- 829 Maple Ave
- 225 E Yates Ave
- 1514 Westview Dr
- 925 6th St
- 1515 Brookside Dr
- 1426 Westview Dr
- 1001 6th St
- 1526 Westview Dr
- 1427 Brookside Dr
- 10 Brookside Dr
- 1527 Brookside Dr
- 1515 Westview Dr
- 1421 Brookside Dr
- 1416 Westview Dr
- 1425 Westview Dr
- 1015 6th St
- 1527 Westview Dr
- 1538 Westview Dr
- 1539 Brookside Dr
- 0 Brookside Dr Unit H115783
- 0 Brookside Dr Unit H115784
- 0 Brookside Dr
Your Personal Tour Guide
Ask me questions while you tour the home.