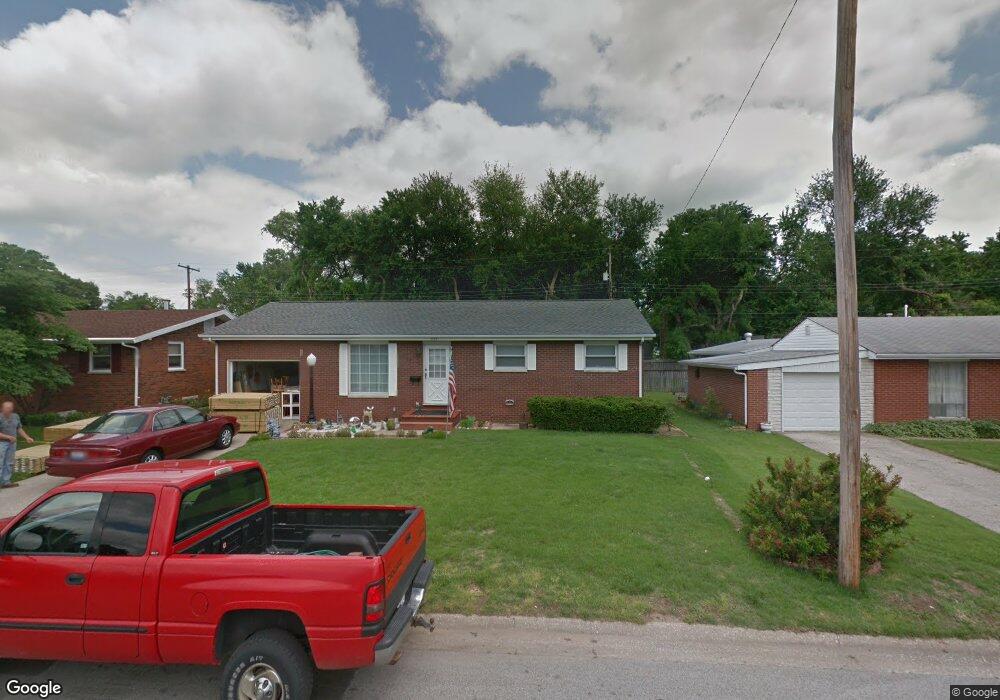
935 Cedar Dr Wood River, IL 62095
Estimated Value: $150,816 - $168,000
4
Beds
1
Bath
1,053
Sq Ft
$150/Sq Ft
Est. Value
About This Home
This home is located at 935 Cedar Dr, Wood River, IL 62095 and is currently estimated at $158,204, approximately $150 per square foot. 935 Cedar Dr is a home located in Madison County with nearby schools including Eastwood Elementary School, East Alton Middle School, and East Alton-Wood River High School.
Ownership History
Date
Name
Owned For
Owner Type
Purchase Details
Closed on
Feb 11, 2022
Sold by
Sally A Barach Trustee
Bought by
Barach Ashton
Current Estimated Value
Purchase Details
Closed on
Oct 27, 2014
Sold by
Barach Diana L
Bought by
Barach Connie
Home Financials for this Owner
Home Financials are based on the most recent Mortgage that was taken out on this home.
Original Mortgage
$60,000
Outstanding Balance
$46,581
Interest Rate
4.37%
Mortgage Type
New Conventional
Estimated Equity
$111,623
Create a Home Valuation Report for This Property
The Home Valuation Report is an in-depth analysis detailing your home's value as well as a comparison with similar homes in the area
Home Values in the Area
Average Home Value in this Area
Purchase History
| Date | Buyer | Sale Price | Title Company |
|---|---|---|---|
| Barach Ashton | -- | None Available | |
| Barach Connie | $100,000 | First American Title Ins Co |
Source: Public Records
Mortgage History
| Date | Status | Borrower | Loan Amount |
|---|---|---|---|
| Open | Barach Connie | $60,000 |
Source: Public Records
Tax History Compared to Growth
Tax History
| Year | Tax Paid | Tax Assessment Tax Assessment Total Assessment is a certain percentage of the fair market value that is determined by local assessors to be the total taxable value of land and additions on the property. | Land | Improvement |
|---|---|---|---|---|
| 2024 | $4,387 | $46,930 | $4,330 | $42,600 |
| 2023 | $4,387 | $43,750 | $4,040 | $39,710 |
| 2022 | $4,148 | $40,380 | $3,730 | $36,650 |
| 2021 | $3,917 | $37,640 | $3,480 | $34,160 |
| 2020 | $3,830 | $36,250 | $3,350 | $32,900 |
| 2019 | $3,115 | $35,170 | $3,250 | $31,920 |
| 2018 | $3,033 | $33,420 | $3,090 | $30,330 |
| 2017 | $2,894 | $32,620 | $3,020 | $29,600 |
| 2016 | $2,905 | $32,620 | $3,020 | $29,600 |
| 2015 | $2,450 | $32,280 | $2,990 | $29,290 |
| 2014 | $2,450 | $32,280 | $2,990 | $29,290 |
| 2013 | $2,450 | $32,740 | $3,030 | $29,710 |
Source: Public Records
Map
Nearby Homes