Estimated Value: $243,000 - $282,000
3
Beds
2
Baths
1,488
Sq Ft
$176/Sq Ft
Est. Value
About This Home
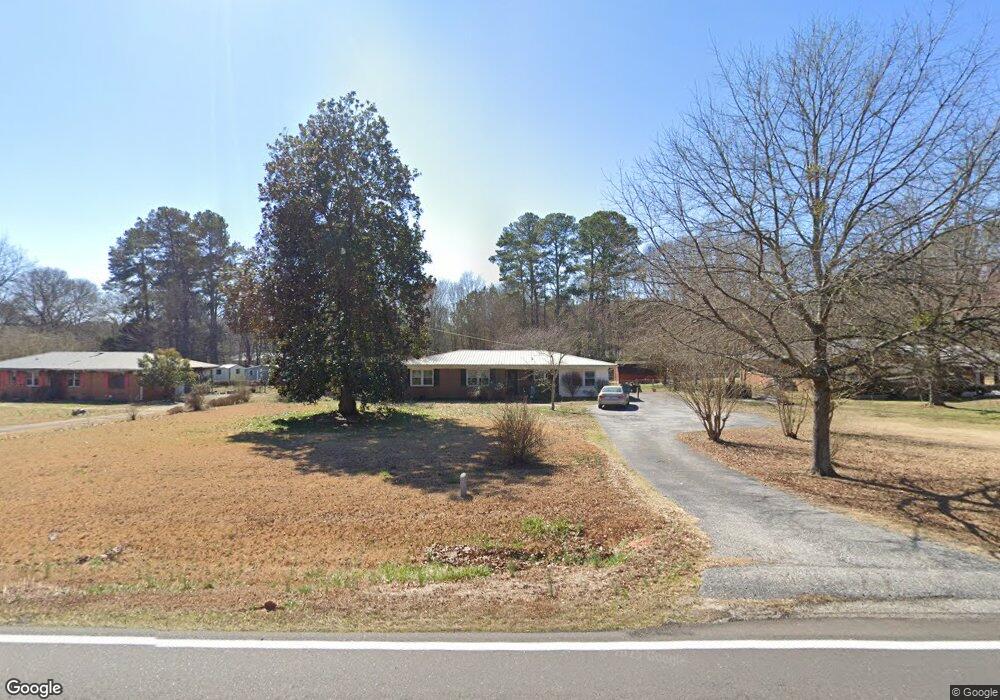
This home is located at 935 Glenn Carrie Rd, Hull, GA 30646 and is currently estimated at $261,307, approximately $175 per square foot. 935 Glenn Carrie Rd is a home located in Madison County with nearby schools including Madison County High School.
Ownership History
Date
Name
Owned For
Owner Type
Purchase Details
Closed on
Jul 6, 2022
Sold by
Mcgarity G Flora
Bought by
Coker Tracy M
Current Estimated Value
Purchase Details
Closed on
Oct 7, 2013
Sold by
Coker Tracy M
Bought by
Mcgarity J Turner and Flora Mcgarity G
Purchase Details
Closed on
Dec 9, 2011
Sold by
Fannie Mae
Bought by
Coker Tracy M
Purchase Details
Closed on
Jul 5, 2011
Sold by
Nationstar Mortgage Llc
Bought by
Federal Home Loan Mortgage Corp
Purchase Details
Closed on
Mar 13, 2001
Sold by
Odom Rosa F Faulkenb
Bought by
Odom Deborah L
Purchase Details
Closed on
Jan 1, 1988
Bought by
Odom Rosa F Faulkenb
Create a Home Valuation Report for This Property
The Home Valuation Report is an in-depth analysis detailing your home's value as well as a comparison with similar homes in the area
Home Values in the Area
Average Home Value in this Area
Purchase History
| Date | Buyer | Sale Price | Title Company |
|---|---|---|---|
| Coker Tracy M | -- | -- | |
| Mcgarity J Turner | -- | -- | |
| Coker Tracy M | $51,000 | -- | |
| Federal Home Loan Mortgage Corp | $100,314 | -- | |
| Nationstar Mortgage Llc | $100,314 | -- | |
| Odom Deborah L | -- | -- | |
| Odom Rosa F Faulkenb | -- | -- |
Source: Public Records
Tax History Compared to Growth
Tax History
| Year | Tax Paid | Tax Assessment Tax Assessment Total Assessment is a certain percentage of the fair market value that is determined by local assessors to be the total taxable value of land and additions on the property. | Land | Improvement |
|---|---|---|---|---|
| 2024 | $1,624 | $62,394 | $15,360 | $47,034 |
| 2023 | $1,810 | $59,282 | $15,360 | $43,922 |
| 2022 | $1,489 | $53,994 | $15,360 | $38,634 |
| 2021 | $1,214 | $39,760 | $12,800 | $26,960 |
| 2020 | $1,188 | $38,636 | $12,800 | $25,836 |
| 2019 | $1,000 | $32,166 | $8,000 | $24,166 |
| 2018 | $970 | $31,094 | $8,000 | $23,094 |
| 2017 | $819 | $28,454 | $8,000 | $20,454 |
| 2016 | $730 | $25,434 | $8,000 | $17,434 |
| 2015 | $680 | $23,690 | $8,000 | $15,690 |
| 2014 | $740 | $25,626 | $8,000 | $17,626 |
| 2013 | -- | $25,626 | $8,000 | $17,626 |
Source: Public Records
Map
Nearby Homes
- 838 Virginia Ln
- 0 Woodland Creek Place Unit 10421130
- 181 Bedford Dr
- 0 Virginia Ln Unit Lot 15 CL336098
- 0 Virginia Ln Unit LOT 15 10579204
- 685 Bedford Dr
- 525 Virginia Ln
- 136 Wellington Dr
- 481 Bedford Dr
- 151 Rolling Woods Ln
- 540 & 542 Harve Mathis Rd
- 1329 Spratlin Mill Dr
- 8986 Highway 29 S
- 300 Harve Mathis Rd
- 1309 Hull Rd
- 1176 Kimberly Cir
- 0 Spratlin Mill Rd Unit 1025918
- 0 Spratlin Mill Rd Unit 10526335
- 915 Glenn Carrie Rd
- 957 Glenn Carrie Rd
- 881 Glenn Carrie Rd
- 967 Virginia Ln
- 977 Glenn Carrie Rd
- 934 Glenn Carrie Rd
- 900 Glenn Carrie Rd
- 914 Glenn Carrie Rd
- 999 Glenn Carrie Rd
- 1031 Virginia Ln
- 931 Virginia Ln
- 841 Glenn Carrie Rd
- 1131 Virginia Ln
- 864 Glenn Carrie Rd
- 1019 Glenn Carrie Rd
- 992 Virginia Ln
- 1000 Glenn Carrie Rd
- 952 Virginia Ln
- 1057 Virginia Ln
- 1055 Virginia Ln