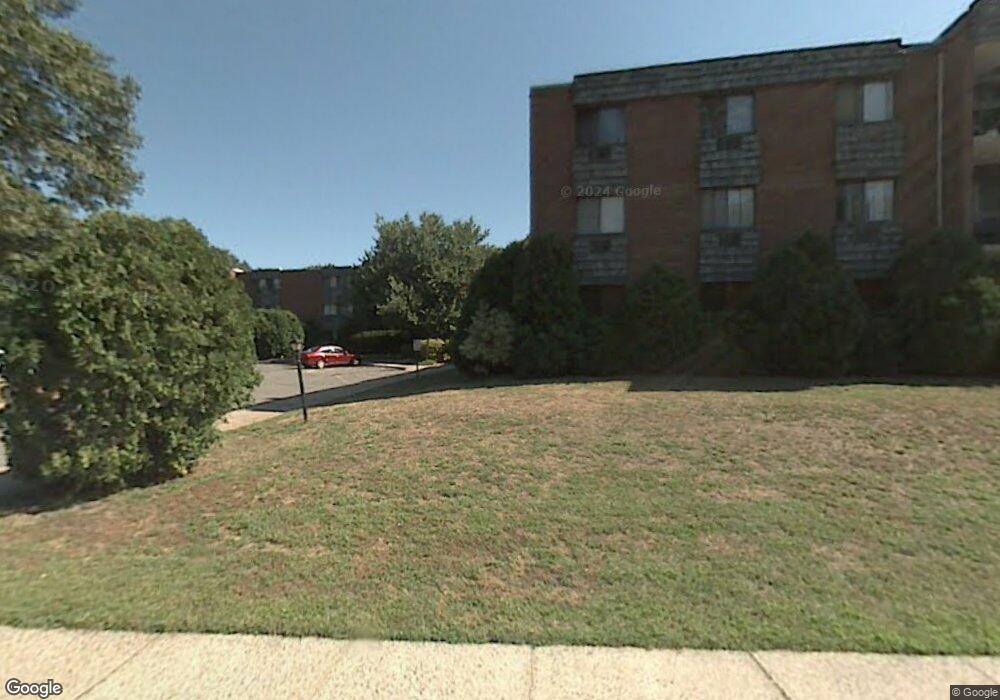
935 High Path Rd Windsor, CT 06095
West Windsor NeighborhoodEstimated Value: $129,000 - $179,000
2
Beds
2
Baths
972
Sq Ft
$168/Sq Ft
Est. Value
About This Home
This home is located at 935 High Path Rd, Windsor, CT 06095 and is currently estimated at $163,135, approximately $167 per square foot. 935 High Path Rd is a home located in Hartford County with nearby schools including Oliver Ellsworth School, John F. Kennedy School, and Sage Park Middle School.
Ownership History
Date
Name
Owned For
Owner Type
Purchase Details
Closed on
Dec 15, 2015
Sold by
Cahill 3Rd John
Bought by
Mollica Joseph N
Current Estimated Value
Home Financials for this Owner
Home Financials are based on the most recent Mortgage that was taken out on this home.
Original Mortgage
$63,000
Outstanding Balance
$49,519
Interest Rate
3.77%
Mortgage Type
New Conventional
Estimated Equity
$113,616
Purchase Details
Closed on
Mar 21, 2012
Sold by
Bank Of New York Mello
Bought by
Cahill 3Rd John
Purchase Details
Closed on
Mar 8, 2010
Sold by
Lewis Shiatika
Bought by
Chateau Wood Condo Ass
Purchase Details
Closed on
May 26, 2006
Sold by
Alicea Hermnio
Bought by
Lewis Shiatika
Home Financials for this Owner
Home Financials are based on the most recent Mortgage that was taken out on this home.
Original Mortgage
$81,600
Interest Rate
8.97%
Mortgage Type
Purchase Money Mortgage
Purchase Details
Closed on
Sep 20, 2005
Sold by
Mangano Thomas
Bought by
Alicea Herminio
Purchase Details
Closed on
Apr 29, 2002
Sold by
Nason Randy
Bought by
Mangano Thomas
Create a Home Valuation Report for This Property
The Home Valuation Report is an in-depth analysis detailing your home's value as well as a comparison with similar homes in the area
Home Values in the Area
Average Home Value in this Area
Purchase History
| Date | Buyer | Sale Price | Title Company |
|---|---|---|---|
| Mollica Joseph N | -- | -- | |
| Cahill 3Rd John | $49,900 | -- | |
| Chateau Wood Condo Ass | -- | -- | |
| Lewis Shiatika | $102,000 | -- | |
| Alicea Herminio | $91,000 | -- | |
| Mangano Thomas | $58,000 | -- |
Source: Public Records
Mortgage History
| Date | Status | Borrower | Loan Amount |
|---|---|---|---|
| Open | Mangano Thomas | $63,000 | |
| Closed | Mangano Thomas | $63,000 | |
| Previous Owner | Mangano Thomas | $81,600 |
Source: Public Records
Tax History
| Year | Tax Paid | Tax Assessment Tax Assessment Total Assessment is a certain percentage of the fair market value that is determined by local assessors to be the total taxable value of land and additions on the property. | Land | Improvement |
|---|---|---|---|---|
| 2025 | $2,348 | $82,530 | $0 | $82,530 |
| 2024 | $2,502 | $82,530 | $0 | $82,530 |
| 2023 | $1,691 | $50,330 | $0 | $50,330 |
| 2022 | $1,674 | $50,330 | $0 | $50,330 |
| 2021 | $1,674 | $50,330 | $0 | $50,330 |
| 2020 | $1,666 | $50,330 | $0 | $50,330 |
| 2019 | $1,630 | $50,330 | $0 | $50,330 |
| 2018 | $1,553 | $47,110 | $0 | $47,110 |
| 2017 | $1,529 | $47,110 | $0 | $47,110 |
| 2016 | $1,485 | $47,110 | $0 | $47,110 |
| 2015 | $1,457 | $47,110 | $0 | $47,110 |
| 2014 | $1,435 | $47,110 | $0 | $47,110 |
Source: Public Records
Map
Nearby Homes
- 943 High Path Rd Unit 943
- 136 High Path Rd
- 98 High Path Rd
- 58 High Path Rd Unit 58
- 118 High Path Rd Unit 118
- 268 High Path Rd Unit 268
- 485 River St
- 22 Apple Tree Ln
- 22 Eastview Dr
- 16 Cornfield Rd
- 211 MacKtown Rd
- 1 Deanne Lynn Cir
- 94 Raymond Rd
- 58 Hollow Brook Rd
- 24 Mary Catherine Cir
- 957 Palisado Ave
- 490 Old Day Hill Rd
- 109 Old Village Cir
- 1946 Poquonock Ave
- 32 Walnut Cir
- 913 High Path Rd
- 935 High Path Rd Unit 935
- 956 High Path Rd
- 957 High Path Rd
- 957 High Path Rd Unit 957
- 934 High Path Rd
- 934 High Path Rd Unit 934
- 912 High Path Rd
- 907 High Path Rd
- 922 High Path Rd
- 955 High Path Rd
- 933 High Path Rd
- 944 High Path Rd
- 901 High Path Rd
- 911 High Path Rd
- 966 High Path Rd
- 966 High Path Rd Unit 966
- 958 High Path Rd
- 923 High Path Rd
- 923 High Path Rd Unit 923
Your Personal Tour Guide
Ask me questions while you tour the home.