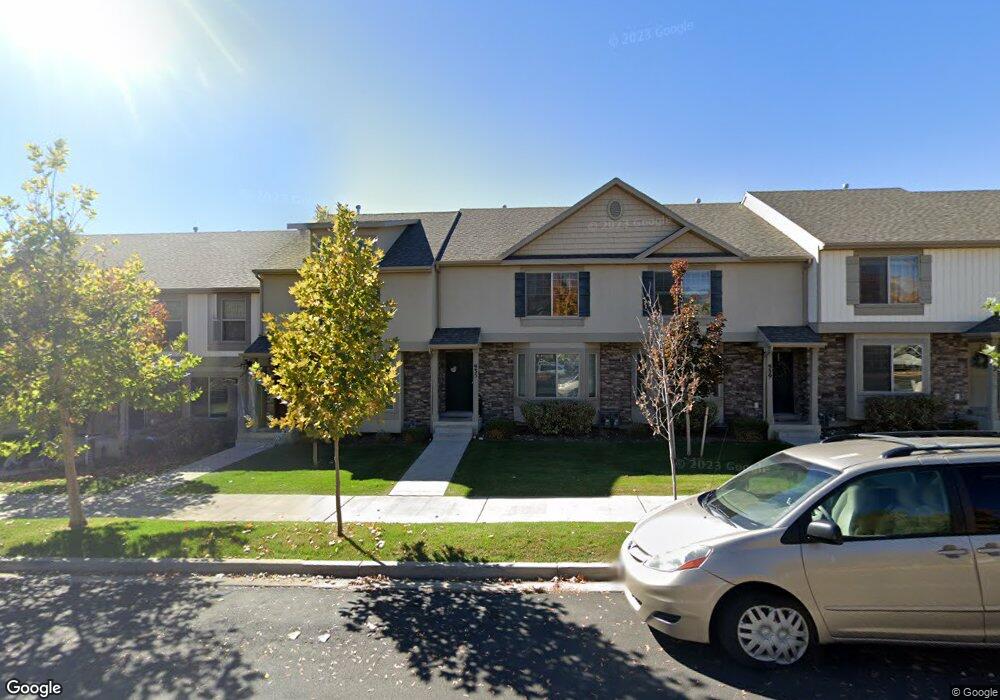
935 Independence Ave Unit 61 Provo, UT 84604
Rivergrove NeighborhoodEstimated Value: $382,000 - $414,000
3
Beds
3
Baths
1,732
Sq Ft
$231/Sq Ft
Est. Value
About This Home
This home is located at 935 Independence Ave Unit 61, Provo, UT 84604 and is currently estimated at $399,847, approximately $230 per square foot. 935 Independence Ave Unit 61 is a home located in Utah County with nearby schools including Westridge Elementary School, Dixon Middle School, and Provo High School.
Ownership History
Date
Name
Owned For
Owner Type
Purchase Details
Closed on
Dec 6, 2019
Sold by
Olson Randall and Olson Nadine
Bought by
Bradley Elyse Marie
Current Estimated Value
Home Financials for this Owner
Home Financials are based on the most recent Mortgage that was taken out on this home.
Original Mortgage
$254,140
Outstanding Balance
$224,716
Interest Rate
3.75%
Mortgage Type
New Conventional
Estimated Equity
$175,131
Purchase Details
Closed on
Oct 23, 2017
Sold by
Rudd Bobby
Bought by
Olson Randall and Olson Nadine
Home Financials for this Owner
Home Financials are based on the most recent Mortgage that was taken out on this home.
Original Mortgage
$147,500
Interest Rate
3.83%
Mortgage Type
New Conventional
Purchase Details
Closed on
Sep 23, 2011
Sold by
Independence Avenue Llc
Bought by
Rudd Bobby
Home Financials for this Owner
Home Financials are based on the most recent Mortgage that was taken out on this home.
Original Mortgage
$155,343
Interest Rate
3.75%
Mortgage Type
FHA
Create a Home Valuation Report for This Property
The Home Valuation Report is an in-depth analysis detailing your home's value as well as a comparison with similar homes in the area
Home Values in the Area
Average Home Value in this Area
Purchase History
| Date | Buyer | Sale Price | Title Company |
|---|---|---|---|
| Bradley Elyse Marie | -- | Us Title Insurance Agency | |
| Olson Randall | -- | Mountain View Title | |
| Rudd Bobby | -- | First American Orem |
Source: Public Records
Mortgage History
| Date | Status | Borrower | Loan Amount |
|---|---|---|---|
| Open | Bradley Elyse Marie | $254,140 | |
| Previous Owner | Olson Randall | $147,500 | |
| Previous Owner | Rudd Bobby | $155,343 |
Source: Public Records
Tax History Compared to Growth
Tax History
| Year | Tax Paid | Tax Assessment Tax Assessment Total Assessment is a certain percentage of the fair market value that is determined by local assessors to be the total taxable value of land and additions on the property. | Land | Improvement |
|---|---|---|---|---|
| 2025 | $2,062 | $206,305 | $55,100 | $320,000 |
| 2024 | $2,062 | $203,005 | $0 | $0 |
| 2023 | $1,940 | $188,265 | $0 | $0 |
| 2022 | $1,985 | $194,205 | $0 | $0 |
| 2021 | $1,556 | $265,500 | $39,800 | $225,700 |
| 2020 | $1,616 | $258,500 | $33,600 | $224,900 |
| 2019 | $1,554 | $258,500 | $33,600 | $224,900 |
| 2018 | $1,422 | $240,000 | $29,000 | $211,000 |
| 2017 | $1,239 | $114,895 | $0 | $0 |
| 2016 | $1,270 | $109,725 | $0 | $0 |
| 2015 | $1,196 | $104,500 | $0 | $0 |
| 2014 | $1,069 | $97,350 | $0 | $0 |
Source: Public Records
Map
Nearby Homes
- 927 Independence Ave
- 962 Independence Ave
- 932 N 1760 W
- 2043 W 1100 N
- 1127 Independence Ave
- 1893 Cascade Dr
- 1620 W 1000 N
- 986 N 1550 W
- 582 N 2310 W
- 2397 W 1160 N
- 2216 W 480 N
- 1503 N 1980 W
- 1574 W 1400 N
- 392 N 2150 W
- 1471 W 1460 N
- 255 N 1600 W Unit 148
- 255 N 1600 W Unit 52
- 255 N 1600 W Unit 84
- 255 N 1600 W Unit 108
- 1104 N 1220 W
- 935 Independence Ave
- 931 Independence Ave Unit 62
- 931 Independence Ave
- 939 Independence Ave Unit 60
- 927 Independence Ave Unit 63
- 943 Independence Ave Unit 59
- 943 Independence Ave
- 923 Independence Ave Unit 64
- 923 Independence Ave
- 947 Independence Ave
- 1323 N 3200 W
- 1307 N 3200 W
- 1888 W 890 N Unit 86
- 1888 W 890 N
- 895 Independence Ave Unit 71
- 895 Independence Ave Unit 65
- 895 Independence Ave
- 1893 W 960 N
- 891 Independence Ave
- 1892 W 890 N Unit 87