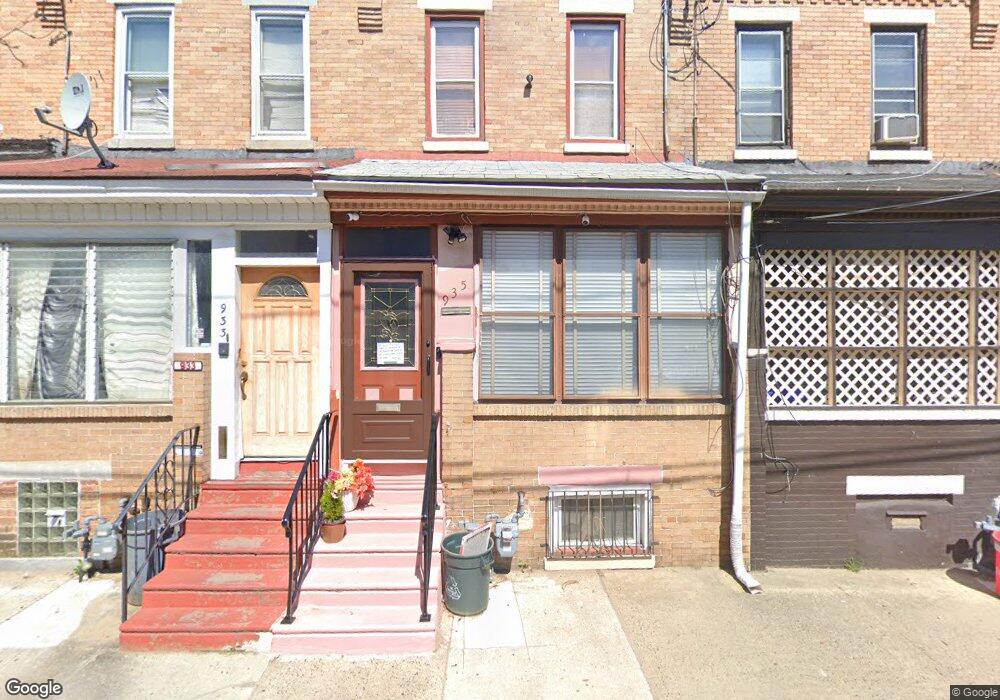
935 Kimber St Camden, NJ 08102
North Camden NeighborhoodEstimated Value: $135,926 - $173,000
Studio
--
Bath
1,080
Sq Ft
$140/Sq Ft
Est. Value
About This Home
This home is located at 935 Kimber St, Camden, NJ 08102 and is currently estimated at $150,732, approximately $139 per square foot. 935 Kimber St is a home located in Camden County with nearby schools including Eastside High School, Leap Academy University Charter School, and Holy Name School.
Ownership History
Date
Name
Owned For
Owner Type
Purchase Details
Closed on
Feb 22, 2018
Sold by
Adderly Timothy
Bought by
Adderly Timothy and Adderly Joy D
Current Estimated Value
Home Financials for this Owner
Home Financials are based on the most recent Mortgage that was taken out on this home.
Original Mortgage
$51,689
Outstanding Balance
$44,448
Interest Rate
4.62%
Mortgage Type
FHA
Estimated Equity
$106,284
Purchase Details
Closed on
Oct 25, 1996
Sold by
Jones William H
Bought by
Adderly Timothy
Create a Home Valuation Report for This Property
The Home Valuation Report is an in-depth analysis detailing your home's value as well as a comparison with similar homes in the area
Home Values in the Area
Average Home Value in this Area
Purchase History
| Date | Buyer | Sale Price | Title Company |
|---|---|---|---|
| Adderly Timothy | -- | Title Source Inc | |
| Adderly Timothy | $21,500 | -- |
Source: Public Records
Mortgage History
| Date | Status | Borrower | Loan Amount |
|---|---|---|---|
| Open | Adderly Timothy | $51,689 |
Source: Public Records
Tax History
| Year | Tax Paid | Tax Assessment Tax Assessment Total Assessment is a certain percentage of the fair market value that is determined by local assessors to be the total taxable value of land and additions on the property. | Land | Improvement |
|---|---|---|---|---|
| 2025 | $1,772 | $50,000 | $5,800 | $44,200 |
| 2024 | $1,713 | $50,000 | $5,800 | $44,200 |
| 2023 | $1,713 | $50,000 | $5,800 | $44,200 |
| 2022 | $1,681 | $50,000 | $5,800 | $44,200 |
| 2021 | $1,675 | $50,000 | $5,800 | $44,200 |
| 2020 | $1,590 | $50,000 | $5,800 | $44,200 |
| 2019 | $1,523 | $50,000 | $5,800 | $44,200 |
| 2018 | $1,515 | $50,000 | $5,800 | $44,200 |
| 2017 | $1,478 | $50,000 | $5,800 | $44,200 |
| 2016 | $1,431 | $50,000 | $5,800 | $44,200 |
| 2015 | $1,377 | $50,000 | $5,800 | $44,200 |
| 2014 | $1,344 | $50,000 | $5,800 | $44,200 |
Source: Public Records
Map
Nearby Homes
Your Personal Tour Guide
Ask me questions while you tour the home.