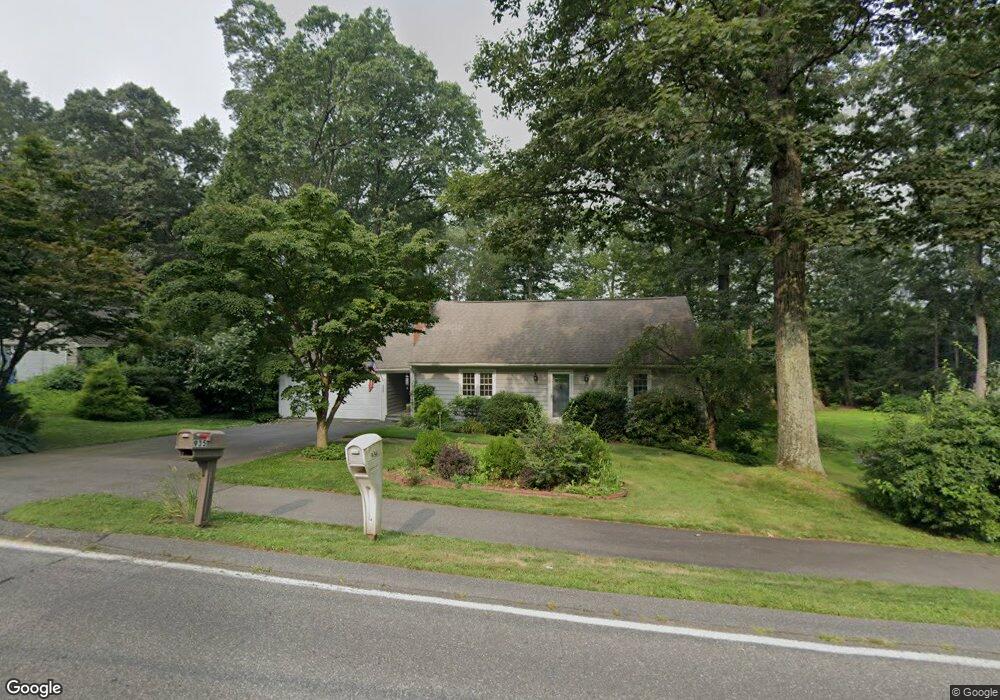
935 Main St Wilbraham, MA 01095
Estimated Value: $412,000 - $609,000
2
Beds
2
Baths
1,804
Sq Ft
$266/Sq Ft
Est. Value
About This Home
This home is located at 935 Main St, Wilbraham, MA 01095 and is currently estimated at $480,743, approximately $266 per square foot. 935 Main St is a home located in Hampden County with nearby schools including Minnechaug Regional High School and Wilbraham & Monson Academy.
Ownership History
Date
Name
Owned For
Owner Type
Purchase Details
Closed on
Jan 26, 2021
Sold by
Farquharson Kirk P and Farquharson Ellen P
Bought by
Kirk P Farquharson T
Current Estimated Value
Purchase Details
Closed on
May 1, 1996
Sold by
Wininger Jay E Est
Bought by
Moriarty Paul J and Moriarty Sheryl L
Home Financials for this Owner
Home Financials are based on the most recent Mortgage that was taken out on this home.
Original Mortgage
$139,650
Interest Rate
7.82%
Mortgage Type
Purchase Money Mortgage
Create a Home Valuation Report for This Property
The Home Valuation Report is an in-depth analysis detailing your home's value as well as a comparison with similar homes in the area
Home Values in the Area
Average Home Value in this Area
Purchase History
| Date | Buyer | Sale Price | Title Company |
|---|---|---|---|
| Kirk P Farquharson T | -- | None Available | |
| Moriarty Paul J | $147,000 | -- |
Source: Public Records
Mortgage History
| Date | Status | Borrower | Loan Amount |
|---|---|---|---|
| Previous Owner | Moriarty Paul J | $139,650 |
Source: Public Records
Tax History Compared to Growth
Tax History
| Year | Tax Paid | Tax Assessment Tax Assessment Total Assessment is a certain percentage of the fair market value that is determined by local assessors to be the total taxable value of land and additions on the property. | Land | Improvement |
|---|---|---|---|---|
| 2025 | $6,644 | $371,600 | $76,800 | $294,800 |
| 2024 | $6,048 | $326,900 | $76,800 | $250,100 |
| 2023 | $58 | $306,900 | $76,800 | $230,100 |
| 2022 | $5,829 | $284,500 | $76,800 | $207,700 |
| 2021 | $5,223 | $227,500 | $82,600 | $144,900 |
| 2020 | $5,091 | $227,500 | $82,600 | $144,900 |
| 2019 | $4,960 | $227,500 | $82,600 | $144,900 |
| 2018 | $4,775 | $210,900 | $82,600 | $128,300 |
| 2017 | $4,442 | $201,900 | $82,600 | $119,300 |
| 2016 | $4,290 | $198,600 | $91,800 | $106,800 |
| 2015 | $4,147 | $198,600 | $91,800 | $106,800 |
Source: Public Records
Map
Nearby Homes