935 Niagara Rd Vinton, VA 24179
Estimated Value: $597,527
Studio
--
Bath
6,523
Sq Ft
$92/Sq Ft
Est. Value
About This Home
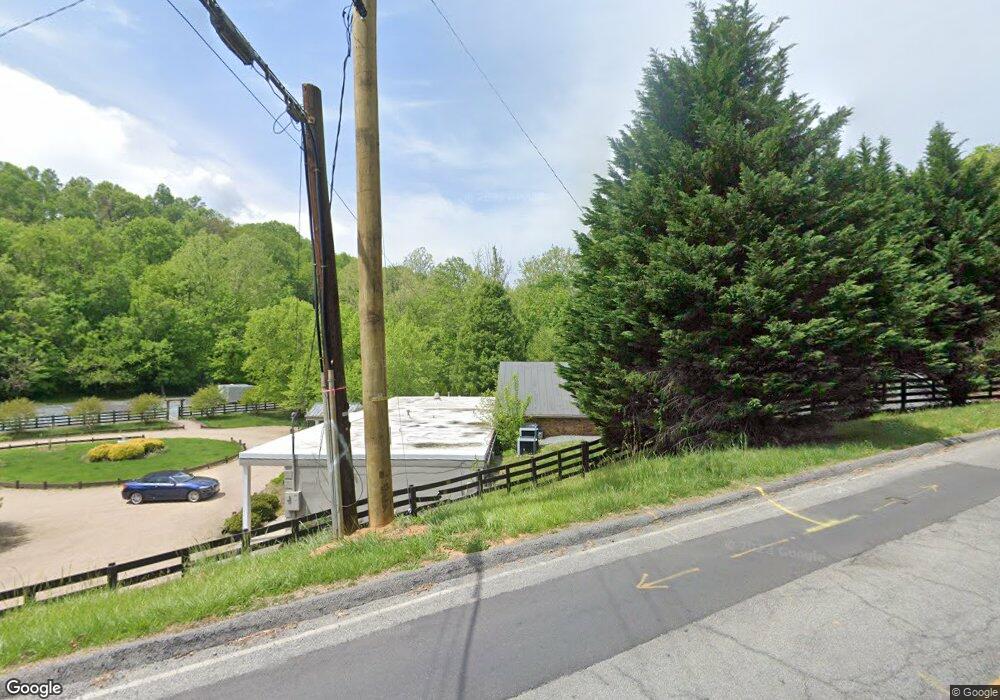
This home is located at 935 Niagara Rd, Vinton, VA 24179 and is currently estimated at $597,527, approximately $91 per square foot. 935 Niagara Rd is a home located in Roanoke County with nearby schools including W.E. Cundiff Elementary School, William Byrd Middle School, and William Byrd High School.
Ownership History
Date
Name
Owned For
Owner Type
Purchase Details
Closed on
Jun 12, 2023
Sold by
Woodland Event Center Llc
Bought by
Jesus The Redeemer Church Inc
Current Estimated Value
Home Financials for this Owner
Home Financials are based on the most recent Mortgage that was taken out on this home.
Original Mortgage
$270,000
Outstanding Balance
$253,777
Interest Rate
6.35%
Mortgage Type
Credit Line Revolving
Estimated Equity
$343,750
Purchase Details
Closed on
Jan 16, 2018
Sold by
Duncan Christopher and Duncan Roger Keith
Bought by
Woodland Event Center Llc
Home Financials for this Owner
Home Financials are based on the most recent Mortgage that was taken out on this home.
Original Mortgage
$329,560
Interest Rate
3.9%
Mortgage Type
Credit Line Revolving
Purchase Details
Closed on
Apr 22, 2016
Sold by
Woodland Place Llc
Bought by
Doncan Roger Keith
Purchase Details
Closed on
Dec 29, 2010
Sold by
Woodland Place Llc
Bought by
Town Of Vinton
Create a Home Valuation Report for This Property
The Home Valuation Report is an in-depth analysis detailing your home's value as well as a comparison with similar homes in the area
Home Values in the Area
Average Home Value in this Area
Purchase History
| Date | Buyer | Sale Price | Title Company |
|---|---|---|---|
| Jesus The Redeemer Church Inc | $530,000 | Fidelity National Title | |
| Woodland Event Center Llc | $359,000 | Fidelity National Title Insu | |
| Doncan Roger Keith | $300,000 | Acquisition Title & Settleme | |
| Town Of Vinton | -- | None Available |
Source: Public Records
Mortgage History
| Date | Status | Borrower | Loan Amount |
|---|---|---|---|
| Open | Jesus The Redeemer Church Inc | $270,000 | |
| Previous Owner | Woodland Event Center Llc | $329,560 |
Source: Public Records
Tax History
| Year | Tax Paid | Tax Assessment Tax Assessment Total Assessment is a certain percentage of the fair market value that is determined by local assessors to be the total taxable value of land and additions on the property. | Land | Improvement |
|---|---|---|---|---|
| 2025 | $5,180 | $502,900 | $125,300 | $377,600 |
| 2024 | $4,658 | $447,900 | $125,300 | $322,600 |
| 2023 | $3,741 | $352,900 | $106,000 | $246,900 |
| 2022 | $3,538 | $324,600 | $96,400 | $228,200 |
| 2021 | $3,477 | $319,000 | $96,400 | $222,600 |
| 2020 | $3,417 | $313,500 | $96,400 | $217,100 |
| 2019 | $3,403 | $312,200 | $96,400 | $215,800 |
| 2018 | $3,201 | $296,100 | $86,800 | $209,300 |
| 2017 | $3,201 | $293,700 | $86,800 | $206,900 |
| 2016 | $3,326 | $305,100 | $86,800 | $218,300 |
| 2015 | $3,294 | $302,200 | $86,600 | $215,600 |
| 2014 | $3,265 | $299,500 | $86,600 | $212,900 |
Source: Public Records
Map
Nearby Homes
- 655 Timberidge Rd
- 1029 Blakemore Cir
- 1020 Lauderdale Ave
- 10685 Hardy Rd
- 1213 Hardy Rd
- TBD Chestnut St
- 425 Jefferson Ave
- 801 Bedford Rd
- 517 Dillon Dr
- 441 Aragona Dr
- 523 Dillon Dr
- 508 E Cleveland Ave
- 624 S Maple St
- 983 Shelbourne Ave
- 0 S Maple St
- 1195 Fairmont Dr
- 0 Breezewood Cir
- 216 W Augusta Ave
- 116 Cedar Ave
- 44 W Cleveland Ave
- 900 Niagara Rd
- 667 Timberidge Rd
- 815 Wyndham Dr
- 888 Colbourne Ave
- 671 Timberidge Rd
- 825 Wyndham Dr
- 663 Timberidge Rd
- 901 Wyndham Dr
- 682 Timberidge Rd
- 659 Timberidge Rd
- 905 Colbourne Ave
- 915 Wyndham Dr
- 912 Colbourne Ave
- 908 Norbourne Ave
- 678 E Augusta Ave
- 911 Colbourne Ave
- 674 E Augusta Ave
- 1135 Vinyard Rd
- 1125 Vinyard Rd
- 874 Lauderdale Ave
Your Personal Tour Guide
Ask me questions while you tour the home.