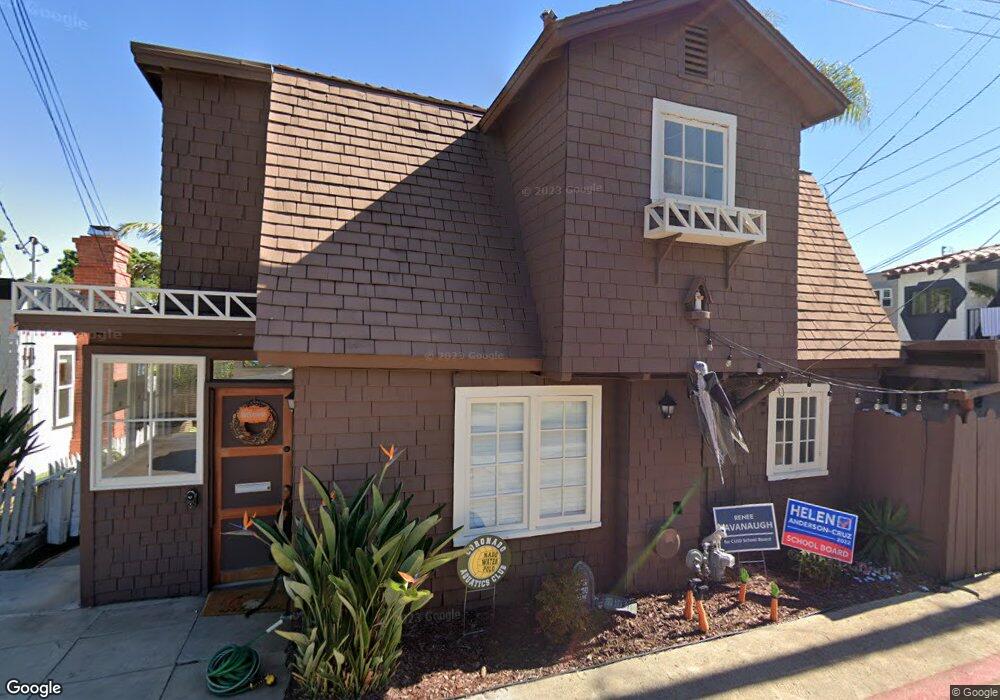
935 Olive Ave Coronado, CA 92118
Estimated Value: $1,622,000 - $2,216,000
2
Beds
1
Bath
684
Sq Ft
$2,680/Sq Ft
Est. Value
About This Home
This home is located at 935 Olive Ave, Coronado, CA 92118 and is currently estimated at $1,833,184, approximately $2,680 per square foot. 935 Olive Ave is a home located in San Diego County with nearby schools including Coronado Village Elementary, Coronado Middle School, and Coronado High School.
Ownership History
Date
Name
Owned For
Owner Type
Purchase Details
Closed on
Jan 26, 2024
Sold by
Gill Catherine
Bought by
2007 Gill Family Trust and Gill
Current Estimated Value
Purchase Details
Closed on
Nov 6, 2023
Sold by
Mcintosh Sarah
Bought by
Gill Catherine
Purchase Details
Closed on
Aug 7, 2023
Sold by
2007 Stephen Lee Lindsey Trust
Bought by
Mcintosh Sarah
Purchase Details
Closed on
Jul 6, 2007
Sold by
Lindsey Stephen Lee
Bought by
Lindsey Stephen Lee
Create a Home Valuation Report for This Property
The Home Valuation Report is an in-depth analysis detailing your home's value as well as a comparison with similar homes in the area
Home Values in the Area
Average Home Value in this Area
Purchase History
| Date | Buyer | Sale Price | Title Company |
|---|---|---|---|
| 2007 Gill Family Trust | -- | None Listed On Document | |
| Gill Catherine | -- | None Listed On Document | |
| Mcintosh Sarah | -- | None Listed On Document | |
| Lindsey Stephen Lee | -- | None Available |
Source: Public Records
Tax History
| Year | Tax Paid | Tax Assessment Tax Assessment Total Assessment is a certain percentage of the fair market value that is determined by local assessors to be the total taxable value of land and additions on the property. | Land | Improvement |
|---|---|---|---|---|
| 2025 | $12,413 | $1,144,440 | $1,040,400 | $104,040 |
| 2024 | $12,413 | $1,122,000 | $1,020,000 | $102,000 |
| 2023 | $1,088 | $42,356 | $30,615 | $11,741 |
| 2022 | $1,079 | $41,526 | $30,015 | $11,511 |
| 2021 | $1,072 | $40,713 | $29,427 | $11,286 |
| 2020 | $1,060 | $40,297 | $29,126 | $11,171 |
| 2019 | $1,058 | $39,507 | $28,555 | $10,952 |
| 2018 | $1,051 | $38,734 | $27,996 | $10,738 |
| 2017 | $1,002 | $37,976 | $27,448 | $10,528 |
| 2016 | $947 | $37,232 | $26,910 | $10,322 |
| 2015 | $901 | $36,673 | $26,506 | $10,167 |
| 2014 | $845 | $35,955 | $25,987 | $9,968 |
Source: Public Records
Map
Nearby Homes
- 909 Olive Ave
- 1027 G Ave
- 811 10th St
- 816 F Ave
- 812 H Ave
- 848 E Ave Unit L2
- 911 9th St
- 1058 Isabella Ave
- 763 G Ave
- 1054 Isabella Ave Unit 58
- 835 E Ave Unit B
- 1074 Isabella Ave
- 1060 Isabella Ave
- 1056 Isabella Ave
- 535 Ocean Blvd
- 933 D Ave
- 1100 Pine St
- 835 D Ave Unit 5
- 835 D Ave Unit 4
- 1155 Star Park Cir Unit 1A
Your Personal Tour Guide
Ask me questions while you tour the home.