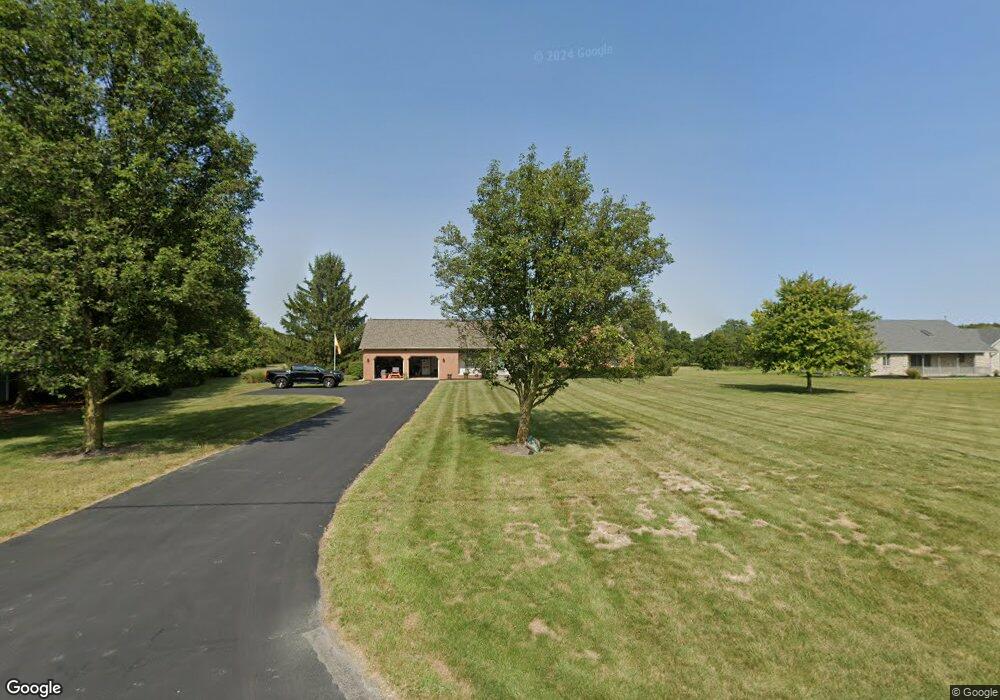
935 Olmstead Rd West Jefferson, OH 43162
Estimated Value: $391,000 - $485,000
3
Beds
2
Baths
1,996
Sq Ft
$222/Sq Ft
Est. Value
About This Home
This home is located at 935 Olmstead Rd, West Jefferson, OH 43162 and is currently estimated at $443,413, approximately $222 per square foot. 935 Olmstead Rd is a home located in Madison County with nearby schools including Norwood Elementary School, West Jefferson Middle School, and West Jefferson High School.
Ownership History
Date
Name
Owned For
Owner Type
Purchase Details
Closed on
Oct 30, 2020
Sold by
Snashall Christine Lee and Snashall Roy
Bought by
Wilson Richard Adam and Wilson Kimberly H
Current Estimated Value
Home Financials for this Owner
Home Financials are based on the most recent Mortgage that was taken out on this home.
Original Mortgage
$299,250
Outstanding Balance
$266,768
Interest Rate
2.9%
Mortgage Type
New Conventional
Estimated Equity
$176,645
Purchase Details
Closed on
Jan 13, 2020
Sold by
Green Roy L
Bought by
Green Roy L and Roy & Dell Green Revocable Tru
Purchase Details
Closed on
Dec 5, 2007
Sold by
Carter Jay D and Carter Freda M
Bought by
Green Roy L and Green Roseanna D
Home Financials for this Owner
Home Financials are based on the most recent Mortgage that was taken out on this home.
Original Mortgage
$195,000
Interest Rate
6.31%
Mortgage Type
Purchase Money Mortgage
Create a Home Valuation Report for This Property
The Home Valuation Report is an in-depth analysis detailing your home's value as well as a comparison with similar homes in the area
Home Values in the Area
Average Home Value in this Area
Purchase History
| Date | Buyer | Sale Price | Title Company |
|---|---|---|---|
| Wilson Richard Adam | $315,000 | Midland Title | |
| Green Roy L | -- | None Available | |
| Green Roy L | $245,000 | None Available |
Source: Public Records
Mortgage History
| Date | Status | Borrower | Loan Amount |
|---|---|---|---|
| Open | Wilson Richard Adam | $299,250 | |
| Previous Owner | Green Roy L | $195,000 |
Source: Public Records
Tax History Compared to Growth
Tax History
| Year | Tax Paid | Tax Assessment Tax Assessment Total Assessment is a certain percentage of the fair market value that is determined by local assessors to be the total taxable value of land and additions on the property. | Land | Improvement |
|---|---|---|---|---|
| 2024 | $5,401 | $122,100 | $20,080 | $102,020 |
| 2023 | $5,401 | $122,100 | $20,080 | $102,020 |
| 2022 | $4,274 | $89,920 | $14,780 | $75,140 |
| 2021 | $4,291 | $89,920 | $14,780 | $75,140 |
| 2020 | $3,943 | $89,920 | $14,780 | $75,140 |
| 2019 | $3,367 | $77,010 | $14,410 | $62,600 |
| 2018 | $3,130 | $77,010 | $14,410 | $62,600 |
| 2017 | $2,670 | $77,010 | $14,410 | $62,600 |
| 2016 | $2,670 | $65,720 | $14,410 | $51,310 |
| 2015 | $2,785 | $65,720 | $14,410 | $51,310 |
| 2014 | $2,785 | $65,720 | $14,410 | $51,310 |
| 2013 | -- | $68,480 | $14,410 | $54,070 |
Source: Public Records
Map
Nearby Homes
- 0 W Jeff Kiousville Rd Unit 225000725
- 700 Shawn Dr Unit 88
- 125 Dogwood Ct
- 304 Middle Dr
- 622 Brookdale Dr
- 63 Jones St
- 1000 W Main St Unit 120
- 1890 Wilson Rd SE
- 360 State Route 142 NE
- 10763 Southwood Rd
- 8629 Canyon Cove Rd
- 8548 Canyon Cove Rd
- 8830 Hubbard Dr N
- 8873 Canoe Dr
- 8482 Dover Crest Ct
- 749 Hubbard Rd
- 9519 High Free Pike
- 3150 Middle Pike
- 1280 Four Star Dr W
- 1278 Lieutenant Dr
- 865 W Jefferson Kiousville Rd SE
- 975 Olmstead Rd
- 815 West Jefferson Kiousville Rd SE
- 895 W Jefferson Kiousville Rd SE
- 940 Olmstead Rd
- 0 Olmstead Rd
- 985 Olmstead Rd
- 818 W Jefferson Kiousville Rd SE
- 818 W Jefferson Kiousville Rd SE
- 980 Olmstead Rd
- 775 W Jeff Kious Rd SE
- 915 W Jefferson Kiousville Rd SE
- 775 W Jefferson Kiousville Rd SE
- 1015 Olmstead Rd
- 830 W Jefferson Kiousville Rd SE
- 830 W Jefferson Kiousville Rd SE
- 1010 Olmstead Rd
- 761 W Jefferson Kiousville Rd SE
- 830 Jeff Kiousville Rd
- 920 W Jefferson Kiousville Rd SE