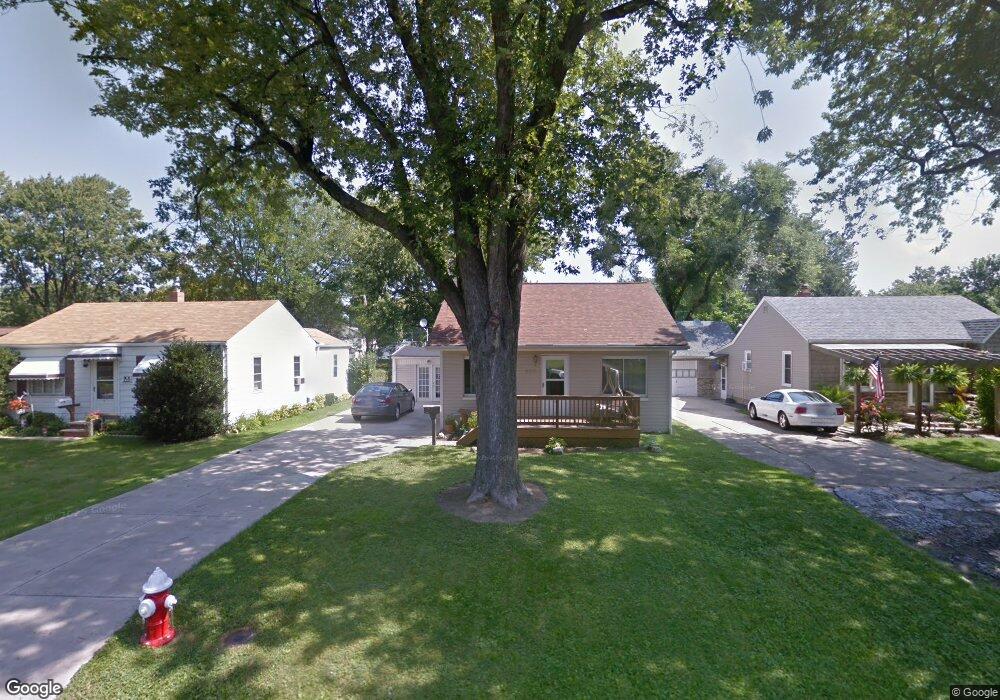
935 Quentin Rd Eastlake, OH 44095
Estimated Value: $133,000 - $166,000
3
Beds
1
Bath
1,027
Sq Ft
$146/Sq Ft
Est. Value
About This Home
This home is located at 935 Quentin Rd, Eastlake, OH 44095 and is currently estimated at $149,892, approximately $145 per square foot. 935 Quentin Rd is a home located in Lake County with nearby schools including Longfellow Elementary School, Willowick Middle School, and North High School.
Ownership History
Date
Name
Owned For
Owner Type
Purchase Details
Closed on
Jan 31, 2023
Sold by
Mcpherson Brian E and Mcpherson Sandra L
Bought by
Porter Rylee K
Current Estimated Value
Purchase Details
Closed on
Dec 17, 2004
Sold by
Nabozny William T
Bought by
Mcpherson Brian E
Home Financials for this Owner
Home Financials are based on the most recent Mortgage that was taken out on this home.
Original Mortgage
$91,200
Interest Rate
9.55%
Mortgage Type
Purchase Money Mortgage
Purchase Details
Closed on
Dec 17, 2003
Sold by
Nabozny William T
Bought by
Mcpherson Brian E
Home Financials for this Owner
Home Financials are based on the most recent Mortgage that was taken out on this home.
Original Mortgage
$80,000
Interest Rate
6.03%
Mortgage Type
Seller Take Back
Purchase Details
Closed on
Jan 30, 1991
Bought by
Nabozny William T
Create a Home Valuation Report for This Property
The Home Valuation Report is an in-depth analysis detailing your home's value as well as a comparison with similar homes in the area
Home Values in the Area
Average Home Value in this Area
Purchase History
| Date | Buyer | Sale Price | Title Company |
|---|---|---|---|
| Porter Rylee K | $611,222 | None Listed On Document | |
| Mcpherson Brian E | $80,000 | Capital Land Title Agency In | |
| Mcpherson Brian E | $80,000 | -- | |
| Nabozny William T | -- | -- |
Source: Public Records
Mortgage History
| Date | Status | Borrower | Loan Amount |
|---|---|---|---|
| Previous Owner | Mcpherson Brian E | $91,200 | |
| Previous Owner | Mcpherson Brian E | $80,000 |
Source: Public Records
Tax History Compared to Growth
Tax History
| Year | Tax Paid | Tax Assessment Tax Assessment Total Assessment is a certain percentage of the fair market value that is determined by local assessors to be the total taxable value of land and additions on the property. | Land | Improvement |
|---|---|---|---|---|
| 2024 | -- | $52,050 | $13,720 | $38,330 |
| 2023 | $3,897 | $40,320 | $10,920 | $29,400 |
| 2022 | $2,445 | $40,320 | $10,920 | $29,400 |
| 2021 | $2,368 | $40,320 | $10,920 | $29,400 |
| 2020 | $2,408 | $35,060 | $9,490 | $25,570 |
| 2019 | $2,791 | $35,060 | $9,490 | $25,570 |
| 2018 | $2,655 | $27,770 | $12,060 | $15,710 |
| 2017 | $2,383 | $27,770 | $12,060 | $15,710 |
| 2016 | $2,298 | $27,770 | $12,060 | $15,710 |
| 2015 | $1,802 | $27,770 | $12,060 | $15,710 |
| 2014 | $1,709 | $27,770 | $12,060 | $15,710 |
| 2013 | $1,709 | $27,770 | $12,060 | $15,710 |
Source: Public Records
Map
Nearby Homes
- 654 E 331st St
- 1263 Jakse Dr
- 343 E 330th St
- 33256 Willowick Dr
- 317 E 330th St
- 493 E 331st St
- 1138 E 331st St
- 476 Woodstock Rd
- 339 E 329th St
- 390 E 332nd St
- 33986 Iris Ln
- 460 E 329th St
- 1238 Hulett Ave
- 33091 Lake Shore Blvd
- 484 E 328th St
- 1271 Hulett Ave
- 483 Campers Dr
- 33862 Beachpark Dr
- 444 E 326th St
- 375 E 324th St
- 947 Quentin Rd
- 923 Quentin Rd
- 913 Quentin Rd
- 957 Quentin Rd
- 901 Quentin Rd
- 973 Quentin Rd
- 954 Woodstock Rd
- 968 Woodstock Rd
- 942 Woodstock Rd
- 980 Woodstock Rd
- 936 Quentin Rd
- 889 Quentin Rd
- 948 Quentin Rd
- 924 Quentin Rd
- 958 Quentin Rd
- 992 Woodstock Rd
- 918 Woodstock Rd
- 914 Quentin Rd
- 970 Quentin Rd
- 989 Quentin Rd