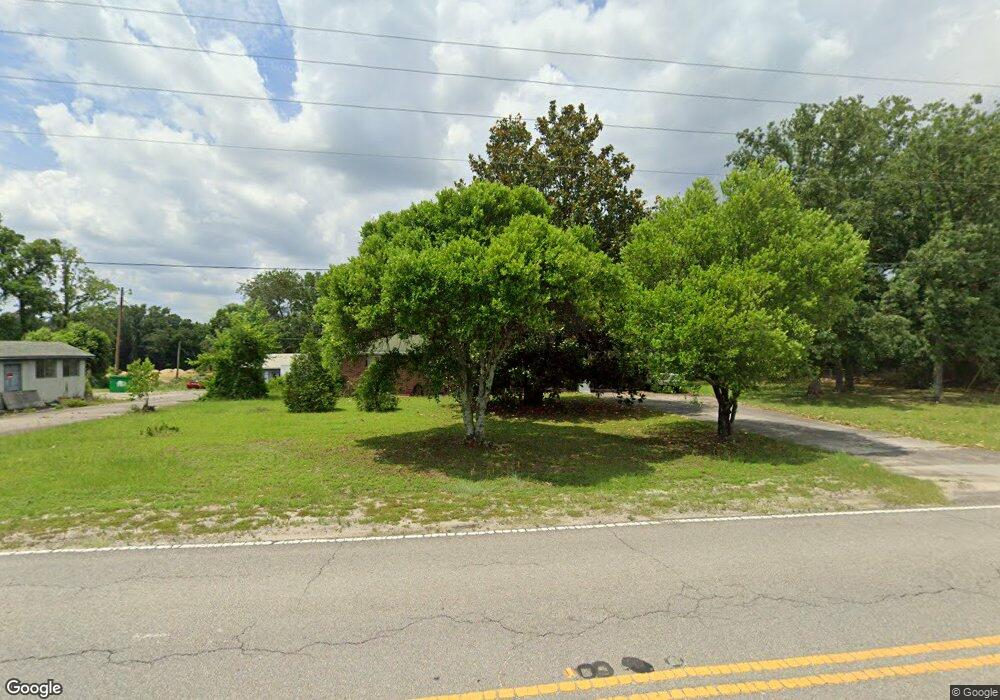
935 Ramblin Rd West Columbia, SC 29170
Estimated Value: $157,000 - $178,011
3
Beds
2
Baths
1,975
Sq Ft
$85/Sq Ft
Est. Value
About This Home
This home is located at 935 Ramblin Rd, West Columbia, SC 29170 and is currently estimated at $167,506, approximately $84 per square foot. 935 Ramblin Rd is a home located in Lexington County with nearby schools including Congaree Elementary School, R. H. Fulmer Middle, and Airport High School.
Ownership History
Date
Name
Owned For
Owner Type
Purchase Details
Closed on
Feb 28, 2019
Sold by
Lowe Robin Q and Best Sandra Q
Bought by
Douglas John P
Current Estimated Value
Home Financials for this Owner
Home Financials are based on the most recent Mortgage that was taken out on this home.
Original Mortgage
$84,000
Outstanding Balance
$73,850
Interest Rate
4.4%
Mortgage Type
New Conventional
Estimated Equity
$93,656
Purchase Details
Closed on
Jul 24, 2014
Sold by
Estate Of Wilma M Quesenberry
Bought by
Lowe Robin Q and Best Sandra Q
Purchase Details
Closed on
Oct 12, 2007
Sold by
Turner Maxwell Lee
Bought by
Westermeyer Millie Arlene
Purchase Details
Closed on
Apr 17, 2007
Sold by
Quesenberry O R
Bought by
Quesenberry Wilma
Purchase Details
Closed on
May 10, 1999
Sold by
Quesenberry O R
Bought by
Sc Dot
Create a Home Valuation Report for This Property
The Home Valuation Report is an in-depth analysis detailing your home's value as well as a comparison with similar homes in the area
Home Values in the Area
Average Home Value in this Area
Purchase History
| Date | Buyer | Sale Price | Title Company |
|---|---|---|---|
| Douglas John P | $99,000 | None Available | |
| Lowe Robin Q | -- | -- | |
| Westermeyer Millie Arlene | -- | None Available | |
| Quesenberry Wilma | -- | None Available | |
| Sc Dot | $2,000 | -- |
Source: Public Records
Mortgage History
| Date | Status | Borrower | Loan Amount |
|---|---|---|---|
| Open | Douglas John P | $84,000 |
Source: Public Records
Tax History Compared to Growth
Tax History
| Year | Tax Paid | Tax Assessment Tax Assessment Total Assessment is a certain percentage of the fair market value that is determined by local assessors to be the total taxable value of land and additions on the property. | Land | Improvement |
|---|---|---|---|---|
| 2024 | $832 | $5,452 | $1,708 | $3,744 |
| 2023 | $772 | $5,452 | $1,708 | $3,744 |
| 2022 | $772 | $5,452 | $1,708 | $3,744 |
| 2020 | $768 | $8,178 | $2,562 | $5,616 |
| 2019 | $779 | $6,315 | $1,708 | $4,607 |
| 2018 | $792 | $6,315 | $1,708 | $4,607 |
| 2017 | $758 | $6,315 | $1,708 | $4,607 |
| 2016 | $783 | $6,314 | $1,708 | $4,606 |
| 2014 | $1,100 | $8,161 | $2,121 | $6,040 |
| 2013 | -- | $8,170 | $2,120 | $6,050 |
Source: Public Records
Map
Nearby Homes
- 1502 Pine St
- 1307 Main St
- 411 Chapel Rd
- 120 Hidden Acres Ln
- 1306 Congaree Dr
- 1123 Pine St
- 4705 McDonald Ave
- 227 Turnfield Dr
- 114 Henston Dr
- 1124 Myrtle Rd
- 420 Congaree Ridge Ct
- 3221 Princeton Rd
- 513 Wellmont Ct
- 114 Hickory Knob Ct
- 632 Spruce Ln
- 108 Laurel Hill Dr
- 109 Sedgewood Ln
- 450 Laurel Mist Ln
- 458 Laurel Mist Ln
- 0 Hyland Cir