Estimated Value: $612,172 - $640,000
3
Beds
3
Baths
2,668
Sq Ft
$235/Sq Ft
Est. Value
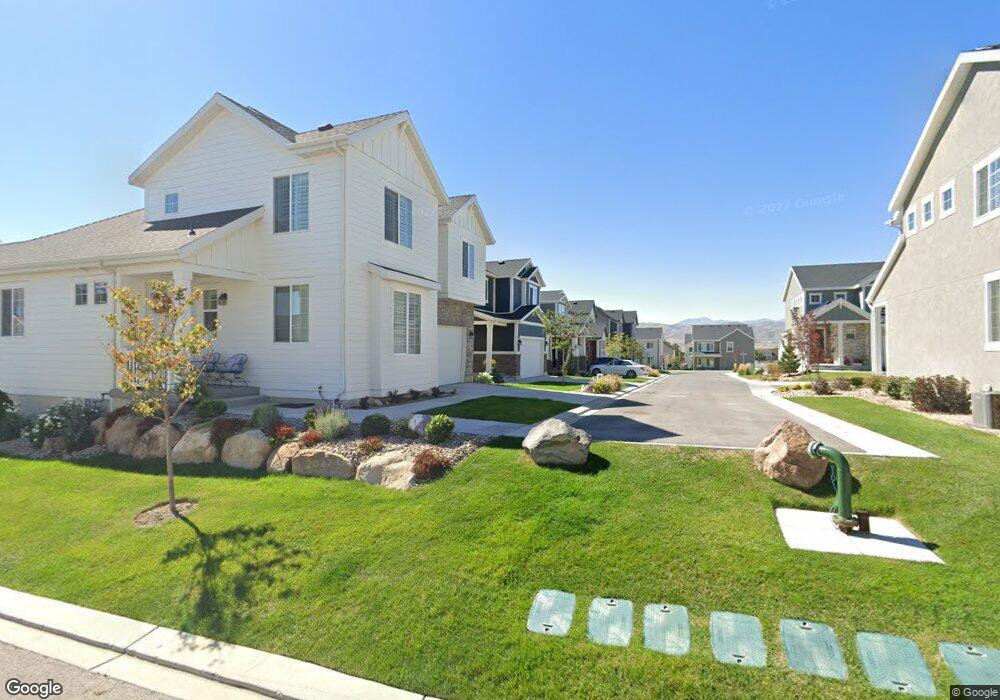
About This Home
This home is located at 935 W 2770 N, Lehi, UT 84043 and is currently estimated at $626,043, approximately $234 per square foot. 935 W 2770 N is a home located in Utah County with nearby schools including Fox Hollow Elementary School, Skyridge High School, and Ignite Entrepreneurship Academy.
Ownership History
Date
Name
Owned For
Owner Type
Purchase Details
Closed on
May 5, 2022
Sold by
Progress Salt Lake City Llc
Bought by
Progress Residential Borrower 19 Llc
Current Estimated Value
Home Financials for this Owner
Home Financials are based on the most recent Mortgage that was taken out on this home.
Original Mortgage
$763,237
Interest Rate
5.25%
Mortgage Type
New Conventional
Purchase Details
Closed on
Sep 2, 2021
Sold by
Nylund Tyler James and Nyland Mercedes Marie
Bought by
Progress Salt Lake City Llc
Purchase Details
Closed on
Aug 27, 2020
Sold by
Nyland Tyler James
Bought by
Nyland Tyler James and Nyland Mercedes Marie
Home Financials for this Owner
Home Financials are based on the most recent Mortgage that was taken out on this home.
Original Mortgage
$359,005
Interest Rate
2.9%
Mortgage Type
New Conventional
Create a Home Valuation Report for This Property
The Home Valuation Report is an in-depth analysis detailing your home's value as well as a comparison with similar homes in the area
Home Values in the Area
Average Home Value in this Area
Purchase History
| Date | Buyer | Sale Price | Title Company |
|---|---|---|---|
| Progress Residential Borrower 19 Llc | -- | Servicelink | |
| Progress Salt Lake City Llc | -- | First Integrity Title Co | |
| Nyland Tyler James | -- | Cottonwood Title Ins Agcy In | |
| Nyland Tyler James | -- | Cottonwood Title Ins Agcy In |
Source: Public Records
Mortgage History
| Date | Status | Borrower | Loan Amount |
|---|---|---|---|
| Previous Owner | Progress Residential Borrower 19 Llc | $763,237 | |
| Previous Owner | Nyland Tyler James | $359,005 |
Source: Public Records
Tax History Compared to Growth
Tax History
| Year | Tax Paid | Tax Assessment Tax Assessment Total Assessment is a certain percentage of the fair market value that is determined by local assessors to be the total taxable value of land and additions on the property. | Land | Improvement |
|---|---|---|---|---|
| 2025 | $2,321 | $302,390 | $208,000 | $341,800 |
| 2024 | $2,321 | $271,590 | $0 | $0 |
| 2023 | $2,193 | $278,630 | $0 | $0 |
| 2022 | $2,106 | $259,380 | $0 | $0 |
| 2021 | $1,962 | $365,300 | $120,400 | $244,900 |
| 2020 | $1,101 | $111,500 | $111,500 | $0 |
Source: Public Records
Map
Nearby Homes
- 2778 N 930 W
- 2687 N 900 W
- 804 W 2700 N
- 2946 N 1080 W
- 1155 W 2980 N
- 1167 W 2980 N
- 1179 W 2980 N
- Rhapsody Plan at Lehi Terrace
- Gallivan Plan at Lehi Terrace
- Concerto Plan at Lehi Terrace
- Grand Plan at Lehi Terrace
- Arietta Plan at Lehi Terrace
- Libby Plan at Lehi Terrace
- Rose Plan at Lehi Terrace
- Capitol Plan at Lehi Terrace
- Metro Plan at Lehi Terrace
- Cantata Plan at Lehi Terrace
- Vieve Plan at Lehi Terrace
- Kilby Plan at Lehi Terrace
- 537 W Sandhill Dr