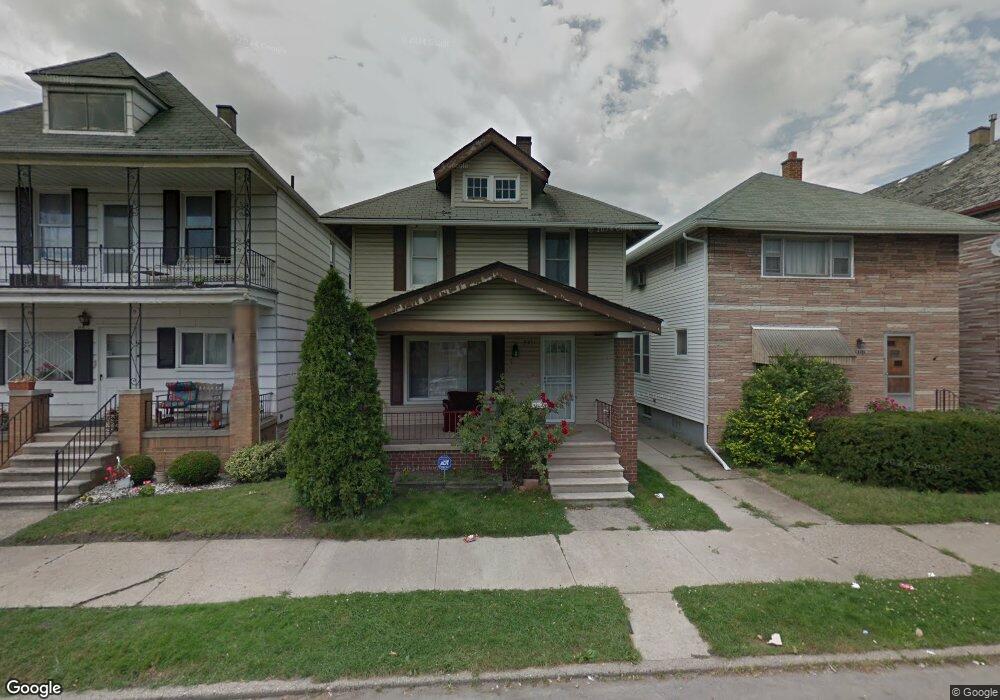
9351 Charest St HamtraMcK, MI 48212
Estimated Value: $162,480 - $191,000
3
Beds
1
Bath
1,000
Sq Ft
$176/Sq Ft
Est. Value
About This Home
This home is located at 9351 Charest St, HamtraMcK, MI 48212 and is currently estimated at $175,620, approximately $175 per square foot. 9351 Charest St is a home located in Wayne County with nearby schools including Dickinson East Elementary School, Kosciuszko Middle School, and Hamtramck High School.
Ownership History
Date
Name
Owned For
Owner Type
Purchase Details
Closed on
Aug 12, 2025
Sold by
Fadhel Najib
Bought by
Faddell Mohamed A
Current Estimated Value
Purchase Details
Closed on
May 7, 2018
Sold by
The Solution Agency Llc
Bought by
Pelukas Joseph and Estate Of Joseph Leonard Pilukas
Purchase Details
Closed on
Feb 11, 2009
Sold by
Secretary Of Housing & Urban Development
Bought by
Fadhel Najib
Purchase Details
Closed on
Jun 13, 2008
Sold by
Wells Fargo Bank Na
Bought by
The Secretary Of Housing & Urban Develop
Purchase Details
Closed on
Dec 12, 2007
Sold by
Latino Michael J
Bought by
Wells Fargo Bank Na
Purchase Details
Closed on
Oct 13, 2005
Sold by
Idzkowski Piotr and Idzkowski Wanda
Bought by
Latino Michael J
Create a Home Valuation Report for This Property
The Home Valuation Report is an in-depth analysis detailing your home's value as well as a comparison with similar homes in the area
Home Values in the Area
Average Home Value in this Area
Purchase History
| Date | Buyer | Sale Price | Title Company |
|---|---|---|---|
| Faddell Mohamed A | -- | None Listed On Document | |
| Pelukas Joseph | $45,000 | None Available | |
| Fadhel Najib | $22,100 | None Available | |
| The Secretary Of Housing & Urban Develop | -- | None Available | |
| Wells Fargo Bank Na | $97,913 | None Available | |
| Latino Michael J | $92,000 | Commonwealth Land Title |
Source: Public Records
Tax History
| Year | Tax Paid | Tax Assessment Tax Assessment Total Assessment is a certain percentage of the fair market value that is determined by local assessors to be the total taxable value of land and additions on the property. | Land | Improvement |
|---|---|---|---|---|
| 2025 | $1,307 | $75,800 | $0 | $0 |
| 2024 | $1,276 | $67,200 | $0 | $0 |
| 2023 | $1,402 | $56,600 | $0 | $0 |
| 2022 | $1,234 | $49,700 | $0 | $0 |
| 2021 | $1,351 | $41,000 | $0 | $0 |
| 2020 | $1,338 | $34,700 | $0 | $0 |
| 2019 | $1,326 | $27,800 | $0 | $0 |
| 2018 | $1,083 | $23,100 | $0 | $0 |
| 2017 | $418 | $19,400 | $0 | $0 |
| 2016 | $956 | $17,400 | $0 | $0 |
| 2015 | $1,650 | $16,500 | $0 | $0 |
| 2013 | $1,680 | $16,800 | $0 | $0 |
| 2012 | $880 | $18,700 | $2,800 | $15,900 |
Source: Public Records
Map
Nearby Homes
- 3321 Holbrook St
- 3321 Doremus St
- 3360 Norwalk St
- 3376 Holbrook St
- 3057 Jacob St
- 3017 Jacob St
- 2978 Evaline St
- 3219 Hanley St
- 3170 Jacob St
- 3368 Evaline St
- 3828 Doremus St
- 8820 Joseph Campau St Unit 3
- 2946 Goodson St
- 2436 Hewitt St
- 3031 Trowbridge St
- 3193 Trowbridge St
- 2455 Andrus St
- 2214 Florian St
- 2248 Faber St
- 2255 Yemans St
- 9345 Charest St
- 9345 Charest St Unit UP
- 9357 Charest St
- 9365 Charest St
- 9335 Charest St
- 9369 Charest St
- 9331 Charest St
- 9356 Mcdougall St
- 9362 Mcdougall St
- 9348 Mcdougall St
- 9375 Charest St
- 9368 Mcdougall St
- 9344 Mcdougall St
- 9381 Charest St
- 9374 Mcdougall St
- 9356 Charest St
- 9350 Charest St
- 9338 Mcdougall St
- 9362 Charest St
- 9344 Charest St
Your Personal Tour Guide
Ask me questions while you tour the home.