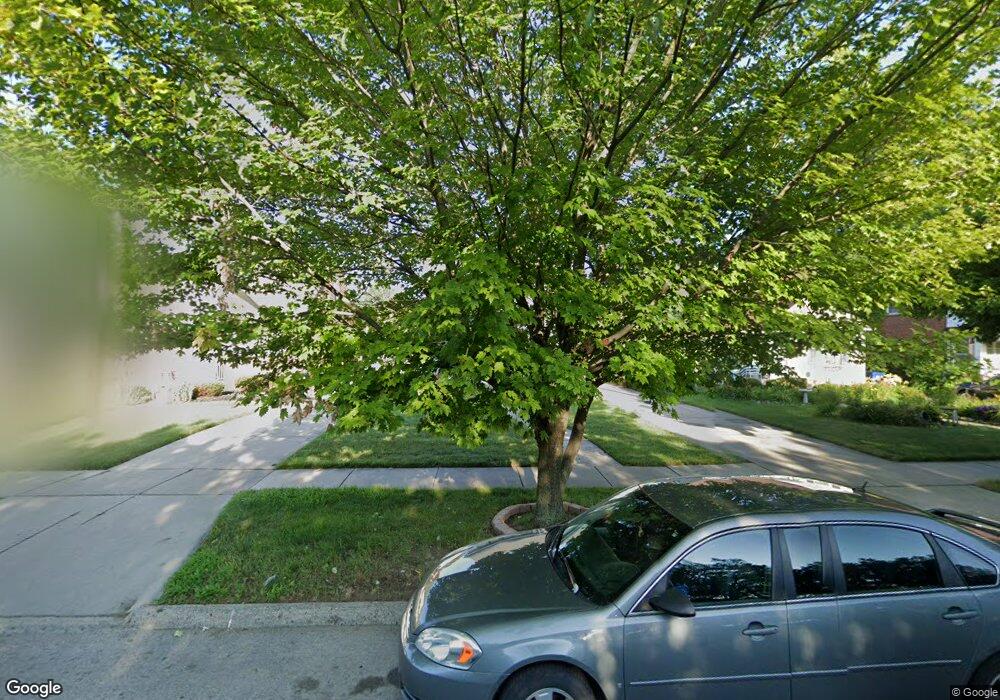
9351 Fenton Redford, MI 48239
Estimated Value: $150,091 - $222,000
3
Beds
2
Baths
1,275
Sq Ft
$151/Sq Ft
Est. Value
About This Home
This home is located at 9351 Fenton, Redford, MI 48239 and is currently estimated at $192,523, approximately $150 per square foot. 9351 Fenton is a home located in Wayne County with nearby schools including John D. Pierce Middle School, Lee M. Thurston High School, and Global Heights Academy.
Ownership History
Date
Name
Owned For
Owner Type
Purchase Details
Closed on
Mar 11, 2013
Sold by
Motor City Home Buyers Llc
Bought by
Renaissance Residential Properties Llc
Current Estimated Value
Purchase Details
Closed on
Oct 15, 2012
Sold by
Wayne County Treasurer
Bought by
Motor City Home Buyers Llc
Purchase Details
Closed on
Aug 3, 2005
Sold by
Kasha Atur A
Bought by
Byrd Kimberley
Purchase Details
Closed on
May 24, 2001
Sold by
Mackenzie Jennifer
Bought by
Kasha Atur A
Purchase Details
Closed on
May 13, 1998
Sold by
Jackson Emily M and Jackson Ruth E
Bought by
Mackenzie Jennifer
Create a Home Valuation Report for This Property
The Home Valuation Report is an in-depth analysis detailing your home's value as well as a comparison with similar homes in the area
Home Values in the Area
Average Home Value in this Area
Purchase History
| Date | Buyer | Sale Price | Title Company |
|---|---|---|---|
| Renaissance Residential Properties Llc | -- | None Available | |
| Motor City Home Buyers Llc | $20,000 | None Available | |
| Byrd Kimberley | $137,900 | Multiple | |
| Kasha Atur A | $125,000 | -- | |
| Mackenzie Jennifer | $90,000 | -- |
Source: Public Records
Tax History Compared to Growth
Tax History
| Year | Tax Paid | Tax Assessment Tax Assessment Total Assessment is a certain percentage of the fair market value that is determined by local assessors to be the total taxable value of land and additions on the property. | Land | Improvement |
|---|---|---|---|---|
| 2025 | $804 | $65,700 | $0 | $0 |
| 2024 | $804 | $60,400 | $0 | $0 |
| 2023 | $768 | $52,500 | $0 | $0 |
| 2022 | $2,081 | $45,200 | $0 | $0 |
| 2021 | $2,020 | $42,800 | $0 | $0 |
| 2020 | $1,993 | $39,500 | $0 | $0 |
| 2019 | $1,953 | $34,400 | $0 | $0 |
| 2018 | $686 | $30,200 | $0 | $0 |
| 2017 | $2,080 | $28,000 | $0 | $0 |
| 2016 | $1,702 | $28,900 | $0 | $0 |
| 2015 | $2,065 | $26,900 | $0 | $0 |
| 2013 | $2,650 | $26,500 | $0 | $0 |
| 2012 | $2,260 | $29,500 | $6,600 | $22,900 |
Source: Public Records
Map
Nearby Homes