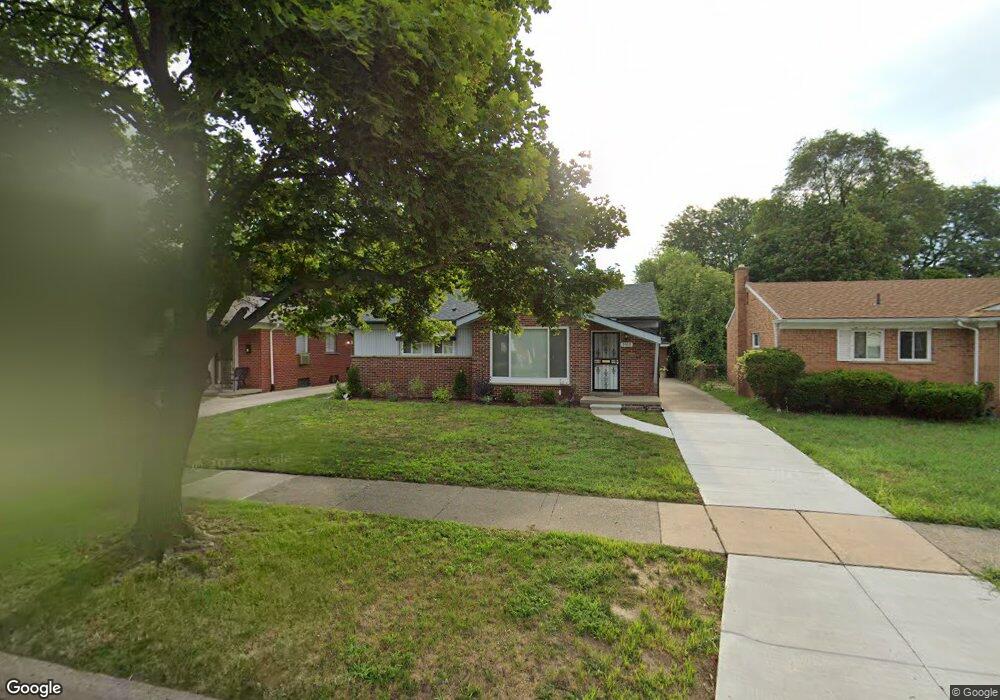
9352 Appleton Unit Bldg-Unit Redford, MI 48239
Estimated Value: $210,000 - $241,000
--
Bed
1
Bath
1,265
Sq Ft
$175/Sq Ft
Est. Value
About This Home
This home is located at 9352 Appleton Unit Bldg-Unit, Redford, MI 48239 and is currently estimated at $221,375, approximately $175 per square foot. 9352 Appleton Unit Bldg-Unit is a home located in Wayne County with nearby schools including John D. Pierce Middle School, Lee M. Thurston High School, and Global Heights Academy.
Ownership History
Date
Name
Owned For
Owner Type
Purchase Details
Closed on
Jun 14, 2018
Sold by
Jrs Funding Llc
Bought by
Graham Lydia D
Current Estimated Value
Purchase Details
Closed on
Aug 25, 2017
Sold by
Charter Township Of Redford
Bought by
Jsr Funding Llc
Purchase Details
Closed on
Aug 21, 2017
Sold by
Sabree Eric R
Bought by
Charter Township Of Redford
Purchase Details
Closed on
Feb 2, 2012
Sold by
Johnson Yvette
Bought by
The Bank Of New York Mellon and The Bank Of New York
Purchase Details
Closed on
Jun 4, 1999
Sold by
Johnson Jason
Bought by
Johnson Yvette
Create a Home Valuation Report for This Property
The Home Valuation Report is an in-depth analysis detailing your home's value as well as a comparison with similar homes in the area
Home Values in the Area
Average Home Value in this Area
Purchase History
| Date | Buyer | Sale Price | Title Company |
|---|---|---|---|
| Graham Lydia D | $112,000 | Visionary Title Agency Llc | |
| Jsr Funding Llc | -- | None Available | |
| Charter Township Of Redford | $10,241 | None Available | |
| The Bank Of New York Mellon | $143,926 | None Available | |
| Johnson Yvette | -- | -- |
Source: Public Records
Tax History Compared to Growth
Tax History
| Year | Tax Paid | Tax Assessment Tax Assessment Total Assessment is a certain percentage of the fair market value that is determined by local assessors to be the total taxable value of land and additions on the property. | Land | Improvement |
|---|---|---|---|---|
| 2025 | $1,182 | $100,000 | $0 | $0 |
| 2024 | $1,182 | $89,000 | $0 | $0 |
| 2023 | $1,132 | $76,700 | $0 | $0 |
| 2022 | $3,224 | $65,400 | $0 | $0 |
| 2021 | $2,640 | $54,900 | $0 | $0 |
| 2020 | $2,604 | $49,400 | $0 | $0 |
| 2019 | $2,547 | $37,700 | $0 | $0 |
| 2018 | $971 | $30,200 | $0 | $0 |
| 2017 | $2,439 | $27,900 | $0 | $0 |
| 2016 | $1,995 | $25,900 | $0 | $0 |
| 2015 | $2,420 | $24,200 | $0 | $0 |
| 2013 | $2,510 | $25,700 | $0 | $0 |
| 2012 | $1,761 | $28,300 | $6,900 | $21,400 |
Source: Public Records
Map
Nearby Homes