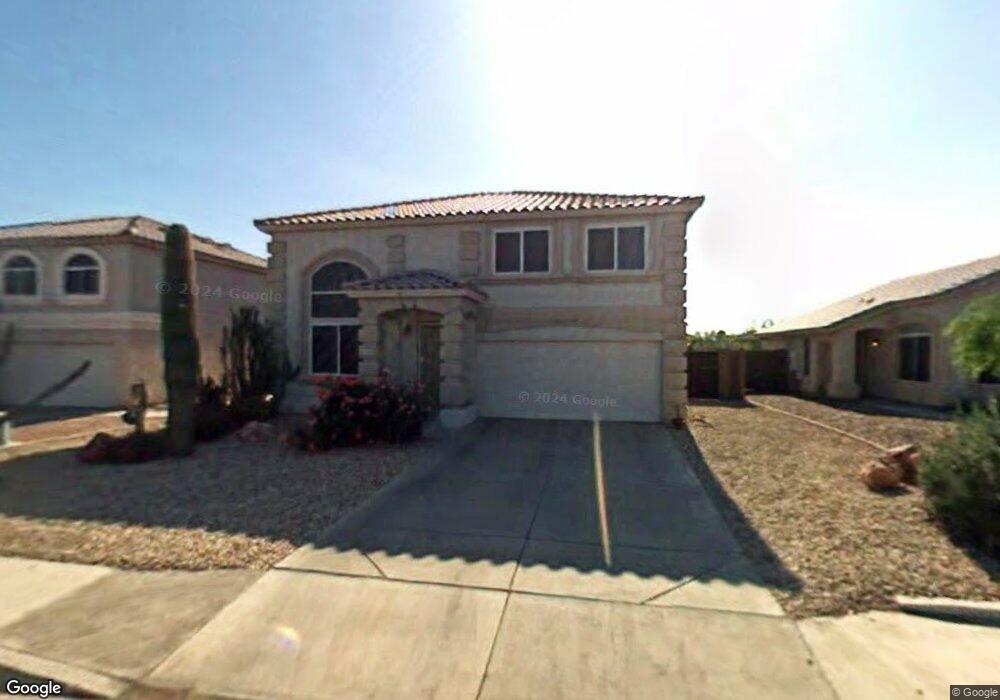
9354 N 97th Dr Peoria, AZ 85345
Estimated Value: $325,685 - $429,000
3
Beds
3
Baths
1,726
Sq Ft
$226/Sq Ft
Est. Value
About This Home
This home is located at 9354 N 97th Dr, Peoria, AZ 85345 and is currently estimated at $390,921, approximately $226 per square foot. 9354 N 97th Dr is a home located in Maricopa County with nearby schools including Sun Valley Elementary School, Raymond S. Kellis, and Ombudsman - Northwest Charter.
Ownership History
Date
Name
Owned For
Owner Type
Purchase Details
Closed on
Oct 26, 2021
Sold by
Avery John C and Avery Lynn E
Bought by
Avery John C and Avery Lynn E
Current Estimated Value
Purchase Details
Closed on
Dec 20, 2001
Sold by
Ciabaton Blase A
Bought by
Avery John C and Gramman Lynn E
Home Financials for this Owner
Home Financials are based on the most recent Mortgage that was taken out on this home.
Original Mortgage
$100,000
Outstanding Balance
$38,901
Interest Rate
6.51%
Estimated Equity
$352,020
Purchase Details
Closed on
Dec 3, 1998
Sold by
Hancock Communities Llc
Bought by
Ciabaton Blase A and Ciabaton Dayanna R
Home Financials for this Owner
Home Financials are based on the most recent Mortgage that was taken out on this home.
Original Mortgage
$115,286
Interest Rate
6.69%
Mortgage Type
FHA
Create a Home Valuation Report for This Property
The Home Valuation Report is an in-depth analysis detailing your home's value as well as a comparison with similar homes in the area
Home Values in the Area
Average Home Value in this Area
Purchase History
| Date | Buyer | Sale Price | Title Company |
|---|---|---|---|
| Avery John C | -- | None Available | |
| Avery John C | $137,500 | Fidelity National Title | |
| Ciabaton Blase A | $116,223 | Lawyers Title Of Arizona Inc | |
| Hancock Communities Llc | -- | Lawyers Title Of Arizona Inc |
Source: Public Records
Mortgage History
| Date | Status | Borrower | Loan Amount |
|---|---|---|---|
| Open | Avery John C | $100,000 | |
| Previous Owner | Ciabaton Blase A | $115,286 |
Source: Public Records
Tax History Compared to Growth
Tax History
| Year | Tax Paid | Tax Assessment Tax Assessment Total Assessment is a certain percentage of the fair market value that is determined by local assessors to be the total taxable value of land and additions on the property. | Land | Improvement |
|---|---|---|---|---|
| 2025 | $1,343 | $17,253 | -- | -- |
| 2024 | $1,323 | $16,431 | -- | -- |
| 2023 | $1,323 | $29,460 | $5,890 | $23,570 |
| 2022 | $1,295 | $22,660 | $4,530 | $18,130 |
| 2021 | $1,387 | $20,610 | $4,120 | $16,490 |
| 2020 | $1,400 | $19,420 | $3,880 | $15,540 |
| 2019 | $1,354 | $17,660 | $3,530 | $14,130 |
| 2018 | $1,310 | $16,470 | $3,290 | $13,180 |
| 2017 | $1,310 | $15,080 | $3,010 | $12,070 |
| 2016 | $1,297 | $14,870 | $2,970 | $11,900 |
| 2015 | $1,210 | $11,610 | $2,320 | $9,290 |
Source: Public Records
Map
Nearby Homes
- 9717 W Purdue Ave
- 9158 N 98th Dr
- 9721 W Mountain View Rd
- 9653 W Purdue Ave
- 9883 N Balboa Dr
- 9891 N Balboa Dr
- 9834 N Balboa Dr
- 9519 W Sunnyslope Ln
- 9616 W Mountain View Rd Unit A
- 9564 W Purdue Ave
- 9814 N Balboa Dr
- 9915 W Mountain View Rd
- 9939 W Ironwood Dr Unit 6D
- 9925 W Mountain View Rd Unit 27
- 9638 W Cinnabar Ave Unit B
- 9450 W Mission Ln
- 10201 N 99th Ave Unit 32A
- 10201 N 99th Ave Unit 46
- 10201 N 99th Ave Unit 44
- 10201 N 99th Ave Unit 97
- 9404 N 97th Dr
- 9344 N 97th Dr
- 9414 N 97th Dr
- 9414 N 97th Dr
- 9334 N 97th Dr
- 9727 W Hatcher Rd
- 9424 N 97th Dr
- 9324 N 97th Dr
- 9734 W Hatcher Rd
- 9728 W Sunnyslope Ln
- 9721 W Hatcher Rd
- 9728 W Hatcher Rd
- 9434 N 97th Dr
- 9739 W Carol Ave
- 9722 W Sunnyslope Ln
- 9722 W Hatcher Rd
- 9444 N 97th Dr
- 9715 W Hatcher Rd
- 9733 W Carol Ave
- 9727 W Carol Ave