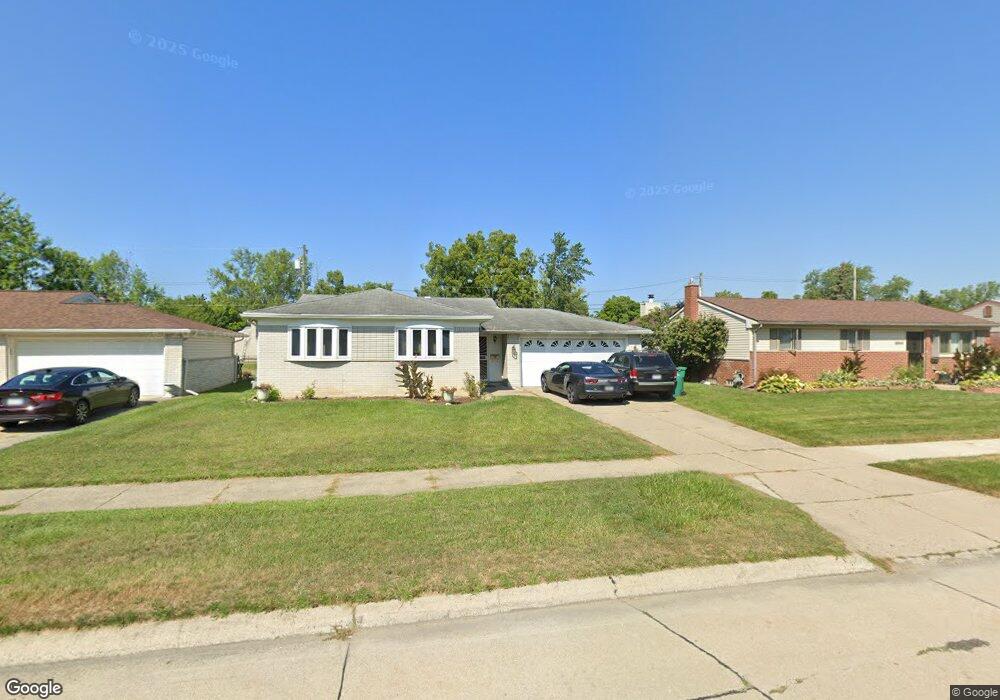
9356 Barry Dr Romulus, MI 48174
Estimated Value: $154,000 - $224,000
3
Beds
2
Baths
1,080
Sq Ft
$166/Sq Ft
Est. Value
About This Home
This home is located at 9356 Barry Dr, Romulus, MI 48174 and is currently estimated at $179,133, approximately $165 per square foot. 9356 Barry Dr is a home located in Wayne County with nearby schools including Wick Elementary School, Romulus Middle School, and Romulus Senior High School.
Ownership History
Date
Name
Owned For
Owner Type
Purchase Details
Closed on
Feb 2, 2009
Sold by
Trott & Trott Pc
Bought by
Chisholm Ebony
Current Estimated Value
Home Financials for this Owner
Home Financials are based on the most recent Mortgage that was taken out on this home.
Original Mortgage
$44,184
Outstanding Balance
$27,645
Interest Rate
4.91%
Mortgage Type
FHA
Estimated Equity
$151,488
Purchase Details
Closed on
Jan 23, 2008
Sold by
Mortgage Electronic Registration Systems
Bought by
Federal National Mortgage Association
Purchase Details
Closed on
Oct 21, 2002
Sold by
Hamby Lucy A
Bought by
Allen Bernard
Purchase Details
Closed on
Jul 29, 1994
Sold by
Dennis M Benshoof
Bought by
Dennis Benshoof
Home Financials for this Owner
Home Financials are based on the most recent Mortgage that was taken out on this home.
Original Mortgage
$61,759
Interest Rate
8.62%
Mortgage Type
FHA
Create a Home Valuation Report for This Property
The Home Valuation Report is an in-depth analysis detailing your home's value as well as a comparison with similar homes in the area
Home Values in the Area
Average Home Value in this Area
Purchase History
| Date | Buyer | Sale Price | Title Company |
|---|---|---|---|
| Chisholm Ebony | $45,000 | Warranty Title Agency Llc | |
| Federal National Mortgage Association | -- | None Available | |
| Mortgage Electronic Registration Systems | $129,929 | None Available | |
| Allen Bernard | $123,000 | -- | |
| Dennis Benshoof | $62,000 | -- |
Source: Public Records
Mortgage History
| Date | Status | Borrower | Loan Amount |
|---|---|---|---|
| Open | Chisholm Ebony | $44,184 | |
| Previous Owner | Dennis Benshoof | $61,759 | |
| Closed | Allen Bernard | -- |
Source: Public Records
Tax History
| Year | Tax Paid | Tax Assessment Tax Assessment Total Assessment is a certain percentage of the fair market value that is determined by local assessors to be the total taxable value of land and additions on the property. | Land | Improvement |
|---|---|---|---|---|
| 2025 | $1,477 | $78,500 | $0 | $0 |
| 2024 | $1,483 | $72,000 | $0 | $0 |
| 2023 | $1,425 | $65,300 | $0 | $0 |
| 2022 | $1,670 | $61,000 | $0 | $0 |
| 2021 | $1,617 | $47,800 | $0 | $0 |
| 2020 | $1,589 | $39,400 | $0 | $0 |
| 2019 | $1,588 | $31,700 | $0 | $0 |
| 2018 | $1,046 | $33,100 | $0 | $0 |
| 2017 | $762 | $32,600 | $0 | $0 |
| 2016 | $1,375 | $30,000 | $0 | $0 |
| 2015 | $2,643 | $28,700 | $0 | $0 |
| 2013 | $2,560 | $27,800 | $0 | $0 |
| 2012 | $810 | $27,200 | $4,700 | $22,500 |
Source: Public Records
Map
Nearby Homes
- 9286 Chamberlain St
- 9274 Chamberlain St
- 35025 Wick Rd
- 9535 Chamberlain St
- 9829 Gary St
- 35773 Surrey Ct
- 35855 Herman St
- 36617 Herman St
- 35344 Ecorse Rd
- 7063 Sargent St
- Vacant Bibbins St
- 35953 Bibbins St
- 11132 Delano St
- VACANT Northline
- VACANT Wayne
- VACANT Burton
- 11238 Moore St
- 000 Waynecorse
- 10401 Ozga St
- 12394 Wahrman St
Your Personal Tour Guide
Ask me questions while you tour the home.