NOT LISTED FOR SALE

9358 Virgil Redford, MI 48239

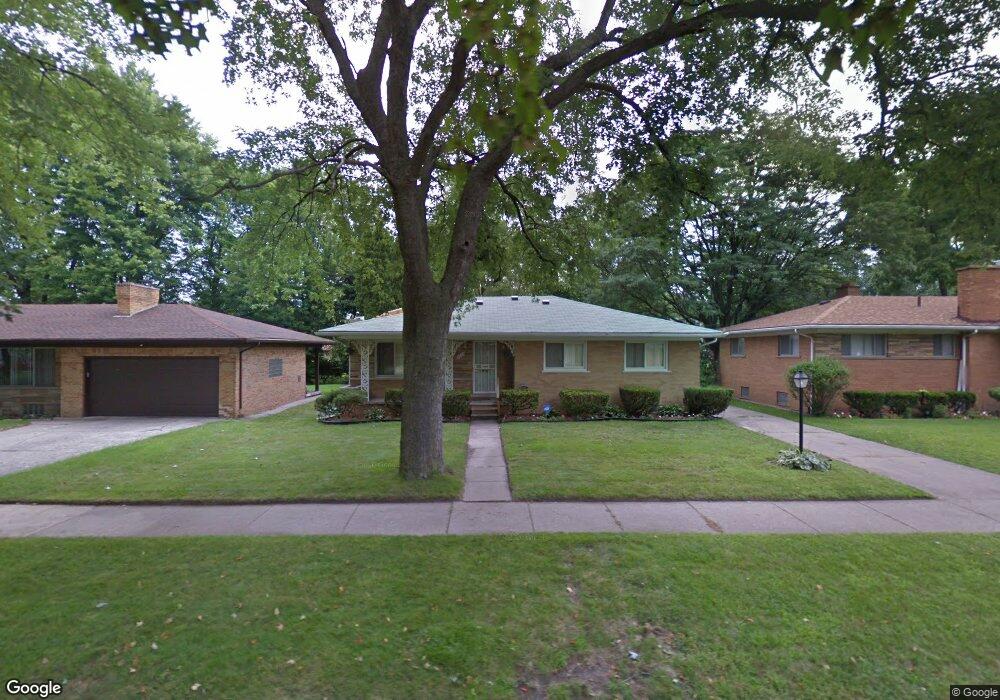
Estimated Value: $180,000 - $238,000

3 Beds
2 Baths
1,512 Sq Ft
$146/Sq Ft Est. Value

Last Sold April 24, 2013

Last sale price $57,201 $38 Per Sq Ft

Est. 286% increase in value since last sale

Current estimated payment $1,267/month

About This Home

As of April 2013

HUD Home.For overbidding and/or escrow repair information, please see attached Overbidding and Escrow Repair MLS addendum.BLB Resources makes no warr as to cond of prop.Byr veri all info.

Ownership History

Date Name Owned For Owner Type

Purchase Details

Listed on
Mar 22, 2013
Closed on
Apr 19, 2013
Sold by
Secretary Of Housing & Urban Development
Bought by
Thompson Sylvia
Seller's Agent
Jeahad Kadaf
Heights Realty Group
Buyer's Agent
FRANK ALSAGHIR
RE/MAX Team 2000
List Price
$45,000
Sold Price
$57,201
Premium/Discount to List
$12,201
27.11%
Current Estimated Value
$220,617

Home Financials for this Owner

Home Financials are based on the most recent Mortgage that was taken out on this home.
Estimated Appreciation
$163,416
Avg. Annual Appreciation
11.39%

Purchase Details

Closed on
Oct 13, 2011
Sold by
Pnc Mortgage
Bought by
The Secretary Of Housing & Urban Develop

Purchase Details

Closed on
Aug 17, 2011
Sold by
Williams Rita
Bought by
Pnc Mortgage

Purchase Details

Closed on
May 2, 1996
Sold by
Williams Rita
Bought by
Joyce L Gardynik
Source: Public Records

Range of Values:

Collateral Analytics

Collateral Analytics Collateral Analytics AVMs (Automated Valuation Model) employ a number of statistical approaches combined with neighborhood-specific comparable selection guarantees the most up-to-date and precise valuations.

Not Available

Collateral Analytics does not have data for the current month. Please view the chart for historical values.

ICE

ICE Mortgage Technology ICE Mortgage Technology’s AVM (Automated Valuation Model) is a state-of-the-art online residential property valuation tool that provides a quick and accurate estimate of the value of almost any home in the U.S.

Not Available

ICE Mortgage Technology does not have data for the current month. Please view the chart for historical values.

First American

First American First American Data & Analytics’ next-generation AVM combines unrivaled data assets with a blended ensemble of valuation models to produce highly accurate, reliable valuations you can trust.

Not Available

First American does not have data for the current month. Please view the chart for historical values.

Quantarium

Quantarium Quantarium’s valuation service, repeatedly proven the industry’s most accurate and comprehensive, is supercharged with a self-learning and auto-tuning AI engine that continually becomes smarter and more accurate as it processes daily inputs from the industry’s leading RE data lake.

Not Available

Quantarium does not have data for the current month. Please view the chart for historical values.

Average Value
Not Available
List Price
Sold Price
Create a Home Valuation Report for This Property
The Home Valuation Report is an in-depth analysis detailing your home's value as well as a comparison with similar homes in the area

Home Values in the Area

Source: Public Records

Average Home Value in this Area


Source: Public Records

Purchase History

Date Buyer Sale Price Title Company
Thompson Sylvia $57,201 None Available
The Secretary Of Housing & Urban Develop -- None Available
Pnc Mortgage $186,610 None Available
Joyce L Gardynik $107,000 --
Source: Public Records

Property History

Date Event Price List to Sale Price per Sq Ft Prior Sale
04/24/2013 04/24/13 Sold $57,201 +27.1% $38 / Sq Ft View Prior Sale
04/01/2013 04/01/13 Pending -- -- --
03/22/2013 03/22/13 For Sale $45,000 -- $30 / Sq Ft

Tax History Compared to Growth

Source: Public Records

Tax History

Year Tax Paid Tax Assessment Tax Assessment Total Assessment is a certain percentage of the fair market value that is determined by local assessors to be the total taxable value of land and additions on the property. Land Improvement
2025 $1,215 $110,300 $0 $0
2024 $1,215 $98,200 $0 $0
2023 $1,161 $84,700 $0 $0
2022 $3,044 $72,300 $0 $0
2021 $2,646 $69,300 $0 $0
2020 $2,303 $62,300 $0 $0
2019 $2,254 $47,200 $0 $0
2018 $743 $38,900 $0 $0
2017 $2,570 $35,700 $0 $0
2016 $2,003 $33,300 $0 $0
2015 $3,120 $31,200 $0 $0
2013 $3,300 $33,000 $0 $0
2012 $2,475 $36,500 $7,900 $28,600
Source: Public Records

Agents Affiliated with this Home

  • Section Image
  • Section Image
See All Agents

Map