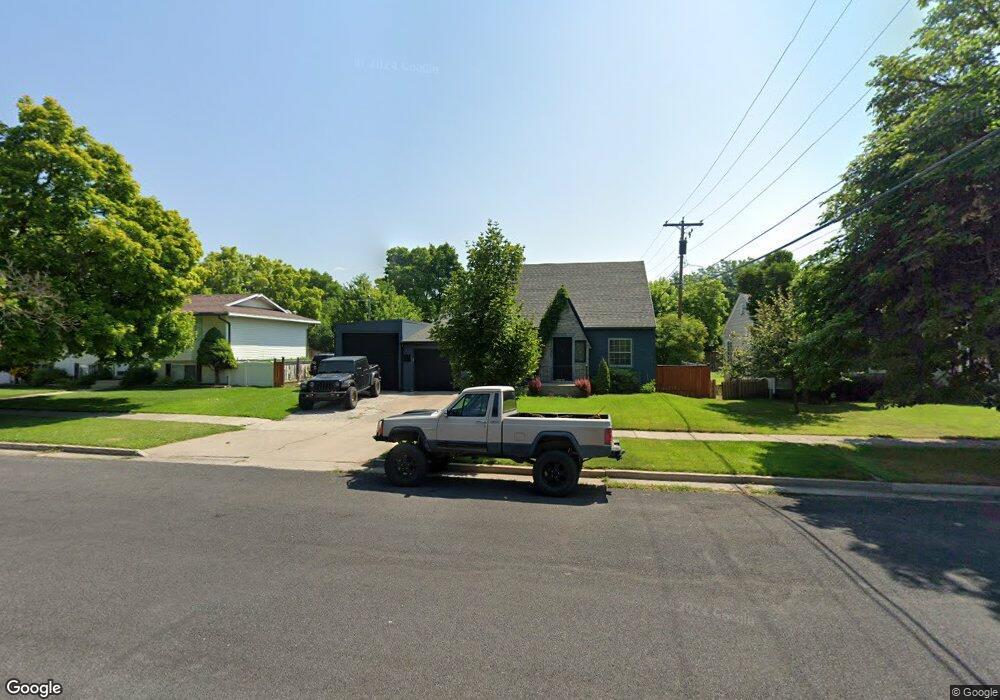
936 N 300 E Logan, UT 84321
Adams NeighborhoodEstimated Value: $388,117 - $407,000
4
Beds
2
Baths
1,862
Sq Ft
$215/Sq Ft
Est. Value
About This Home
This home is located at 936 N 300 E, Logan, UT 84321 and is currently estimated at $399,529, approximately $214 per square foot. 936 N 300 E is a home located in Cache County with nearby schools including Adams Elementary School, Mount Logan Middle School, and Logan High School.
Ownership History
Date
Name
Owned For
Owner Type
Purchase Details
Closed on
Sep 9, 2019
Sold by
Morris Sterling and Morris Kendra
Bought by
Jess Tyson D
Current Estimated Value
Home Financials for this Owner
Home Financials are based on the most recent Mortgage that was taken out on this home.
Original Mortgage
$228,435
Outstanding Balance
$200,067
Interest Rate
3.7%
Mortgage Type
New Conventional
Estimated Equity
$199,462
Purchase Details
Closed on
Jan 8, 2018
Sold by
Morris Sterling Ross
Bought by
Morris Sterling and Morris Kendra
Home Financials for this Owner
Home Financials are based on the most recent Mortgage that was taken out on this home.
Original Mortgage
$126,000
Interest Rate
3.9%
Mortgage Type
New Conventional
Purchase Details
Closed on
Sep 30, 2013
Sold by
Anderson Jeremy S
Bought by
Morris Sterling Ross
Home Financials for this Owner
Home Financials are based on the most recent Mortgage that was taken out on this home.
Original Mortgage
$132,063
Interest Rate
4.26%
Mortgage Type
FHA
Purchase Details
Closed on
Feb 19, 2009
Sold by
Valiente Debra
Bought by
Anderson Jeremy S
Home Financials for this Owner
Home Financials are based on the most recent Mortgage that was taken out on this home.
Original Mortgage
$132,275
Interest Rate
4.92%
Mortgage Type
FHA
Purchase Details
Closed on
Feb 16, 2007
Sold by
Bates Debra
Bought by
Valiente Debra
Purchase Details
Closed on
Oct 10, 2006
Sold by
Lugtu Marilyn B
Bought by
Bates Debra
Home Financials for this Owner
Home Financials are based on the most recent Mortgage that was taken out on this home.
Original Mortgage
$116,000
Interest Rate
6.44%
Mortgage Type
New Conventional
Purchase Details
Closed on
Oct 1, 2004
Sold by
Lugtu Romeo L and Lugtu Marilyn B
Bought by
Lugtu Marilyn B
Create a Home Valuation Report for This Property
The Home Valuation Report is an in-depth analysis detailing your home's value as well as a comparison with similar homes in the area
Home Values in the Area
Average Home Value in this Area
Purchase History
| Date | Buyer | Sale Price | Title Company |
|---|---|---|---|
| Jess Tyson D | -- | Investors Title Ins Agcy Inc | |
| Morris Sterling | -- | -- | |
| Morris Sterling Ross | -- | Pinnacle Title Ins Agency | |
| Anderson Jeremy S | -- | Pinnacle Title Ins Agency | |
| Valiente Debra | -- | Pinnacle Title Ins Agency | |
| Bates Debra | -- | Hickman Land Title Company | |
| Lugtu Marilyn B | -- | None Available |
Source: Public Records
Mortgage History
| Date | Status | Borrower | Loan Amount |
|---|---|---|---|
| Open | Jess Tyson D | $228,435 | |
| Previous Owner | Morris Sterling | $126,000 | |
| Previous Owner | Morris Sterling Ross | $132,063 | |
| Previous Owner | Anderson Jeremy S | $132,275 | |
| Previous Owner | Bates Debra | $116,000 |
Source: Public Records
Tax History
| Year | Tax Paid | Tax Assessment Tax Assessment Total Assessment is a certain percentage of the fair market value that is determined by local assessors to be the total taxable value of land and additions on the property. | Land | Improvement |
|---|---|---|---|---|
| 2025 | $1,513 | $195,710 | $0 | $0 |
| 2024 | $1,557 | $195,055 | $0 | $0 |
| 2023 | $1,625 | $194,050 | $0 | $0 |
| 2022 | $2,157 | $193,615 | $0 | $0 |
| 2021 | $1,701 | $293,040 | $45,000 | $248,040 |
| 2020 | $1,521 | $235,800 | $45,000 | $190,800 |
| 2019 | $1,106 | $164,056 | $45,000 | $119,056 |
| 2018 | $1,117 | $151,300 | $45,000 | $106,300 |
| 2017 | $1,048 | $75,020 | $0 | $0 |
| 2016 | $1,086 | $70,620 | $0 | $0 |
| 2015 | $1,024 | $70,620 | $0 | $0 |
| 2014 | $925 | $70,620 | $0 | $0 |
| 2013 | -- | $70,620 | $0 | $0 |
Source: Public Records
Map
Nearby Homes
Your Personal Tour Guide
Ask me questions while you tour the home.