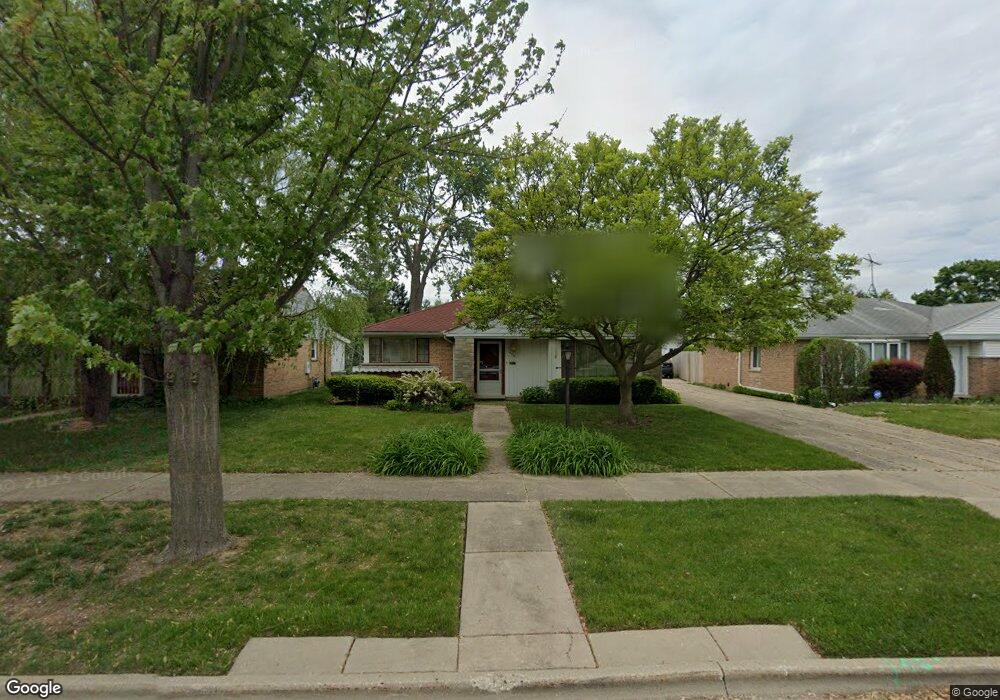
936 S 3rd Ave Des Plaines, IL 60016
Estimated Value: $305,000 - $333,205
2
Beds
1
Bath
1,019
Sq Ft
$317/Sq Ft
Est. Value
About This Home
This home is located at 936 S 3rd Ave, Des Plaines, IL 60016 and is currently estimated at $323,051, approximately $317 per square foot. 936 S 3rd Ave is a home located in Cook County with nearby schools including Forest Elementary School, Algonquin Middle School, and Maine West High School.
Ownership History
Date
Name
Owned For
Owner Type
Purchase Details
Closed on
Sep 7, 2001
Sold by
Weidenmiller Thomas E
Bought by
Weidenmiller Thomas E and Thomas E Weidenmiller Sr Trust
Current Estimated Value
Purchase Details
Closed on
Jun 22, 2001
Sold by
Weidenmiller Thomas E
Bought by
Weidenmiller Thomas E
Home Financials for this Owner
Home Financials are based on the most recent Mortgage that was taken out on this home.
Original Mortgage
$136,000
Interest Rate
7.16%
Purchase Details
Closed on
Nov 30, 2000
Sold by
Weidenmiller Thomas E and Weidenmiller Thomas E
Bought by
Weidenmiller Thomas E and The Thomas E Weidenmiller Sr Trust
Create a Home Valuation Report for This Property
The Home Valuation Report is an in-depth analysis detailing your home's value as well as a comparison with similar homes in the area
Home Values in the Area
Average Home Value in this Area
Purchase History
| Date | Buyer | Sale Price | Title Company |
|---|---|---|---|
| Weidenmiller Thomas E | -- | -- | |
| Weidenmiller Thomas E | -- | -- | |
| Weidenmiller Thomas E | -- | -- |
Source: Public Records
Mortgage History
| Date | Status | Borrower | Loan Amount |
|---|---|---|---|
| Closed | Weidenmiller Thomas E | $136,000 |
Source: Public Records
Tax History Compared to Growth
Tax History
| Year | Tax Paid | Tax Assessment Tax Assessment Total Assessment is a certain percentage of the fair market value that is determined by local assessors to be the total taxable value of land and additions on the property. | Land | Improvement |
|---|---|---|---|---|
| 2024 | $6,064 | $23,000 | $5,148 | $17,852 |
| 2023 | $5,918 | $23,000 | $5,148 | $17,852 |
| 2022 | $5,918 | $23,000 | $5,148 | $17,852 |
| 2021 | $4,722 | $15,363 | $4,290 | $11,073 |
| 2020 | $4,643 | $15,363 | $4,290 | $11,073 |
| 2019 | $4,646 | $17,262 | $4,290 | $12,972 |
| 2018 | $4,908 | $16,411 | $3,775 | $12,636 |
| 2017 | $4,821 | $16,411 | $3,775 | $12,636 |
| 2016 | $4,560 | $16,411 | $3,775 | $12,636 |
| 2015 | $2,691 | $13,399 | $3,260 | $10,139 |
| 2014 | $3,205 | $13,399 | $3,260 | $10,139 |
| 2013 | $3,108 | $13,399 | $3,260 | $10,139 |
Source: Public Records
Map
Nearby Homes
- 858 E Grant Dr
- 911 E Villa Dr
- 881 E Thacker St
- 886 E Thacker St
- 1056 E Villa Dr
- 714 E Thacker St
- 1157 W Grant Dr
- 906 Alfini Dr
- 915 Graceland Ave Unit 1E
- 648 1st Ave
- 520 E Thacker St
- 1205 S Wolf Rd
- 799 Graceland Ave Unit 504A
- 514 S 4th Ave
- 1394 Carol Ln
- 434 E Thacker St
- 1057 Hollywood Ave
- 1365 Ashland Ave Unit 302
- 1380 Oakwood Ave Unit 306
- 508 Crestwood Dr