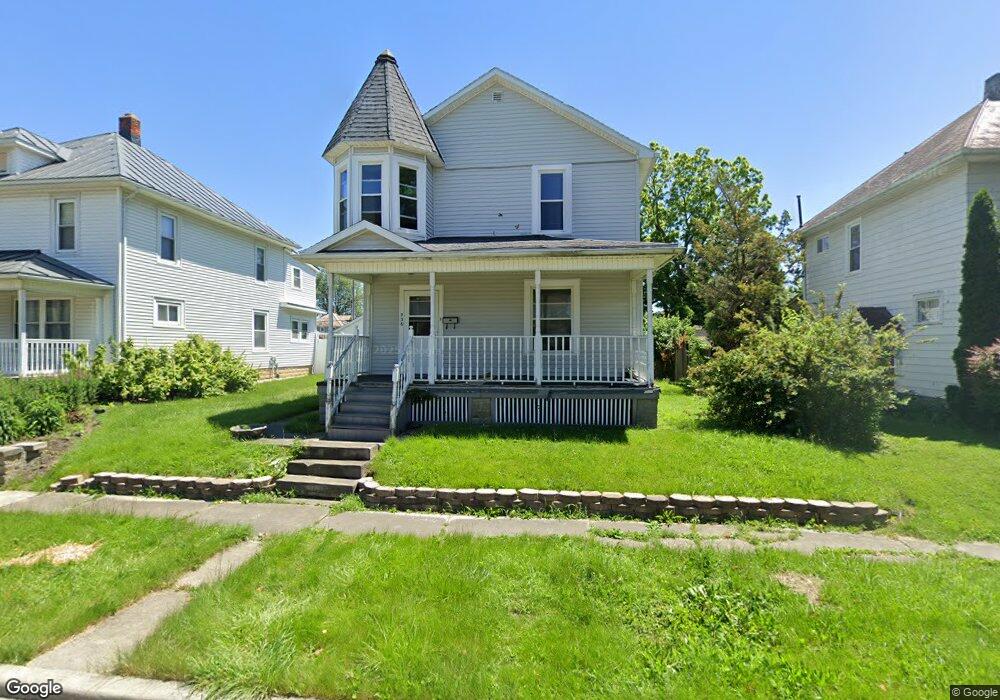
936 S Walnut St Bucyrus, OH 44820
Estimated Value: $134,479 - $184,000
3
Beds
2
Baths
1,654
Sq Ft
$92/Sq Ft
Est. Value
About This Home
This home is located at 936 S Walnut St, Bucyrus, OH 44820 and is currently estimated at $152,620, approximately $92 per square foot. 936 S Walnut St is a home located in Crawford County with nearby schools including Bucyrus Elementary School, Bucyrus Secondary School, and CENTER FOR AUTISM / DYSLEXIA - BUCYRUS.
Ownership History
Date
Name
Owned For
Owner Type
Purchase Details
Closed on
Mar 29, 2024
Sold by
Robison Jacqueline Evelyn and Robison James Thomas
Bought by
Girton Chloe M
Current Estimated Value
Home Financials for this Owner
Home Financials are based on the most recent Mortgage that was taken out on this home.
Original Mortgage
$80,000
Outstanding Balance
$78,829
Interest Rate
6.99%
Mortgage Type
New Conventional
Estimated Equity
$73,791
Purchase Details
Closed on
May 30, 2008
Sold by
Crawford Land Development Llc
Bought by
Robison James T and Robison Jacqueline E
Home Financials for this Owner
Home Financials are based on the most recent Mortgage that was taken out on this home.
Original Mortgage
$109,500
Interest Rate
5.93%
Mortgage Type
Purchase Money Mortgage
Purchase Details
Closed on
Oct 19, 2007
Sold by
Linser Bonnie L and Linser Bonnie L
Bought by
Crawford Land Development Llc
Create a Home Valuation Report for This Property
The Home Valuation Report is an in-depth analysis detailing your home's value as well as a comparison with similar homes in the area
Home Values in the Area
Average Home Value in this Area
Purchase History
| Date | Buyer | Sale Price | Title Company |
|---|---|---|---|
| Girton Chloe M | $100,000 | Chicago Title | |
| Robison James T | $110,000 | -- | |
| Crawford Land Development Llc | $14,800 | -- |
Source: Public Records
Mortgage History
| Date | Status | Borrower | Loan Amount |
|---|---|---|---|
| Open | Girton Chloe M | $80,000 | |
| Previous Owner | Robison James T | $109,500 |
Source: Public Records
Tax History Compared to Growth
Tax History
| Year | Tax Paid | Tax Assessment Tax Assessment Total Assessment is a certain percentage of the fair market value that is determined by local assessors to be the total taxable value of land and additions on the property. | Land | Improvement |
|---|---|---|---|---|
| 2024 | $1,635 | $37,220 | $4,720 | $32,500 |
| 2023 | $1,635 | $25,810 | $3,600 | $22,210 |
| 2022 | $1,342 | $25,810 | $3,600 | $22,210 |
| 2021 | $1,339 | $25,810 | $3,600 | $22,210 |
| 2020 | $1,208 | $22,080 | $3,600 | $18,480 |
| 2019 | $1,235 | $22,080 | $3,600 | $18,480 |
| 2018 | $1,229 | $22,080 | $3,600 | $18,480 |
| 2017 | $1,119 | $19,410 | $3,600 | $15,810 |
| 2016 | $1,084 | $19,410 | $3,600 | $15,810 |
| 2015 | $1,069 | $19,410 | $3,600 | $15,810 |
| 2014 | $1,064 | $19,410 | $3,600 | $15,810 |
| 2013 | $1,064 | $19,410 | $3,600 | $15,810 |
Source: Public Records
Map
Nearby Homes
- 823 S Walnut St
- 1021 S Sandusky Ave
- 900 S Spring St
- 221 W Oakwood Ave
- 419 Short St
- 622 S Poplar St
- 427 E Southern Ave
- 1211 S Sandusky Ave
- 550 S Walnut St
- 346 Hopley Ave
- 1258 S Sandusky Ave
- 531 S Poplar St
- 325 W Liberty St
- 603 Kaler Ave
- 706 E Oakwood Ave
- 444 Woodlawn Ave
- 452 Pleasant Ln
- 314 S Spring St
- 317 S Spring St
- 508 W Charles St
- 930 S Walnut St
- 942 S Walnut St
- 942 S Walnut St
- 928 S Walnut St
- 946 S Walnut St
- 946 S Walnut St
- 218 E Southern Ave
- 922 S Walnut St
- 941 Rogers St
- 933 Rogers St
- 929 Rogers St
- 943 Rogers St
- 918 S Walnut St
- 1000 S Walnut St
- 945 Rogers St
- 927 Rogers St
- 939 S Walnut St
- 925 Rogers St
- 941 S Walnut St
- 931 S Walnut St