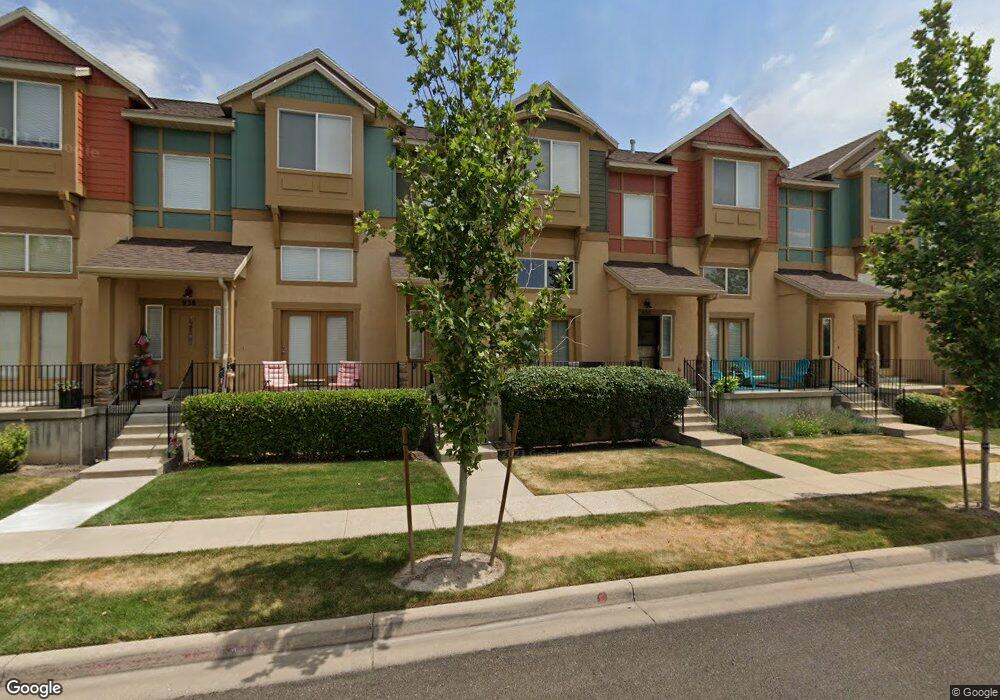
936 Shepard Creek Pkwy Farmington, UT 84025
Estimated Value: $392,000 - $415,000
2
Beds
3
Baths
1,498
Sq Ft
$270/Sq Ft
Est. Value
About This Home
This home is located at 936 Shepard Creek Pkwy, Farmington, UT 84025 and is currently estimated at $404,157, approximately $269 per square foot. 936 Shepard Creek Pkwy is a home located in Davis County with nearby schools including Knowlton Elementary School, Farmington High, and Farmington Junior High School.
Ownership History
Date
Name
Owned For
Owner Type
Purchase Details
Closed on
Jul 8, 2024
Sold by
Dews Ian
Bought by
Chaudoin Makenzie
Current Estimated Value
Purchase Details
Closed on
May 24, 2021
Sold by
Piercy Megan N
Bought by
Dews Ian
Purchase Details
Closed on
Oct 25, 2010
Sold by
Bowers Joshua David and Bowers Pamela
Bought by
Thompson Shaun D and Stevenson Shaylee
Home Financials for this Owner
Home Financials are based on the most recent Mortgage that was taken out on this home.
Original Mortgage
$158,334
Interest Rate
4.25%
Mortgage Type
FHA
Purchase Details
Closed on
Oct 18, 2006
Sold by
Farmington Development Corp
Bought by
Bowers Joshua David and Bowers Pamela
Home Financials for this Owner
Home Financials are based on the most recent Mortgage that was taken out on this home.
Original Mortgage
$140,064
Interest Rate
6.46%
Mortgage Type
FHA
Create a Home Valuation Report for This Property
The Home Valuation Report is an in-depth analysis detailing your home's value as well as a comparison with similar homes in the area
Home Values in the Area
Average Home Value in this Area
Purchase History
| Date | Buyer | Sale Price | Title Company |
|---|---|---|---|
| Chaudoin Makenzie | -- | Truly Title | |
| Chaudoin Makenzie | -- | Truly Title | |
| Dews Ian | -- | Metro Natl Title Asso | |
| Dews Ian | -- | None Listed On Document | |
| Thompson Shaun D | -- | Pinnacle Title Ins Agency | |
| Bowers Joshua David | -- | Bonneville Superior Title Co |
Source: Public Records
Mortgage History
| Date | Status | Borrower | Loan Amount |
|---|---|---|---|
| Previous Owner | Thompson Shaun D | $158,334 | |
| Previous Owner | Bowers Joshua David | $140,064 |
Source: Public Records
Tax History Compared to Growth
Tax History
| Year | Tax Paid | Tax Assessment Tax Assessment Total Assessment is a certain percentage of the fair market value that is determined by local assessors to be the total taxable value of land and additions on the property. | Land | Improvement |
|---|---|---|---|---|
| 2025 | $2,219 | $220,000 | $70,400 | $149,600 |
| 2024 | $2,140 | $215,050 | $52,250 | $162,800 |
| 2023 | $2,128 | $391,000 | $103,000 | $288,000 |
| 2022 | $2,098 | $217,250 | $66,000 | $151,250 |
| 2021 | $1,901 | $293,000 | $91,800 | $201,200 |
| 2020 | $1,723 | $258,000 | $79,900 | $178,100 |
| 2019 | $1,726 | $250,000 | $70,000 | $180,000 |
| 2018 | $1,545 | $220,000 | $70,000 | $150,000 |
| 2016 | $1,323 | $97,350 | $20,900 | $76,450 |
| 2015 | $1,244 | $86,812 | $20,900 | $65,912 |
| 2014 | $1,256 | $90,379 | $18,333 | $72,046 |
| 2013 | -- | $95,316 | $14,850 | $80,466 |
Source: Public Records
Map
Nearby Homes
- 907 Farmington Crossing
- 1008 N Shepard Creek Pkwy Unit 5
- 1048 Shepard Creek Pkwy Unit 4
- 1090 N Shepard Creek Pkwy Unit 6
- 695 W Hidden Farm Dr
- 1485 W Burke Ln Unit 102
- 1493 W Burke Ln Unit 101
- 1177 Shepard Ln
- 588 W 1175 N
- Major League Roof Deck + Basement Plan at Station Park
- Cabo + Basement Plan at Station Park
- 1327 Hidden Quail Cove Unit 6-A
- 388 Quail Run Rd
- 604 Sego Way Unit 207
- 1181 Set Ct Unit 2
- 1484 W Kiera Ct Unit 146
- 1472 W Cook Ln Unit 164
- 1488 W Kiera Ct Unit 148
- 1212 Pinehurst Cir
- 1512 Cherry Blossom Dr
- 936 N Shepherd Creek Pkwy W
- 938 Shepard Creek Pkwy
- 932 Shepard Creek Pkwy
- 942 Shepard Creek Pkwy
- 944 Shepard Creek Pkwy
- 939 Farmington Crossing
- 929 Farmington Crossing
- 946 Shepard Creek Pkwy
- 943 Farmington Crossing
- 927 Farmington Crossing
- 945 Farmington Crossing
- 948 Shepard Creek Pkwy
- 918 Shepard Creek Pkwy
- 919 Farmington Crossing
- 916 Shepard Creek Pkwy
- 949 Farmington Crossing
- 917 Farmington Crossing
- 947 Farmington Crossing
- 912 Shepard Creek Pkwy
- 943 W Spring Creek Ln