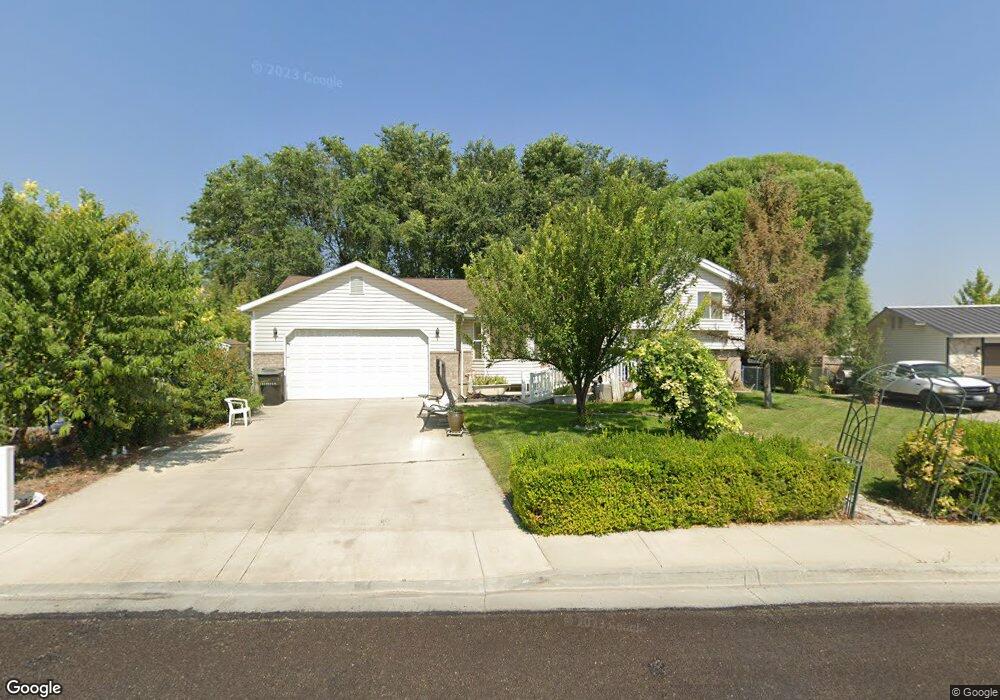
936 W 675 N Tremonton, UT 84337
Estimated Value: $391,427 - $472,000
Studio
--
Bath
1,312
Sq Ft
$326/Sq Ft
Est. Value
About This Home
This home is located at 936 W 675 N, Tremonton, UT 84337 and is currently estimated at $427,607, approximately $325 per square foot. 936 W 675 N is a home located in Box Elder County with nearby schools including North Park School, Alice C. Harris Intermediate School, and Bear River Middle School.
Ownership History
Date
Name
Owned For
Owner Type
Purchase Details
Closed on
Mar 23, 2007
Sold by
Hughes John M
Bought by
Hughes Marlene M and Hughes John M
Current Estimated Value
Home Financials for this Owner
Home Financials are based on the most recent Mortgage that was taken out on this home.
Original Mortgage
$255,000
Interest Rate
6.29%
Mortgage Type
Reverse Mortgage Home Equity Conversion Mortgage
Create a Home Valuation Report for This Property
The Home Valuation Report is an in-depth analysis detailing your home's value as well as a comparison with similar homes in the area
Home Values in the Area
Average Home Value in this Area
Purchase History
| Date | Buyer | Sale Price | Title Company |
|---|---|---|---|
| Hughes Marlene M | -- | Advanced Land Title Agency |
Source: Public Records
Mortgage History
| Date | Status | Borrower | Loan Amount |
|---|---|---|---|
| Closed | Hughes Marlene M | $255,000 |
Source: Public Records
Tax History
| Year | Tax Paid | Tax Assessment Tax Assessment Total Assessment is a certain percentage of the fair market value that is determined by local assessors to be the total taxable value of land and additions on the property. | Land | Improvement |
|---|---|---|---|---|
| 2025 | $361 | $404,403 | $105,000 | $299,403 |
| 2024 | $240 | $404,650 | $105,000 | $299,650 |
| 2023 | $2,455 | $408,993 | $100,000 | $308,993 |
| 2022 | $280 | $219,044 | $19,250 | $199,794 |
| 2021 | $1,886 | $239,446 | $35,000 | $204,446 |
| 2020 | $1,583 | $239,446 | $35,000 | $204,446 |
| 2019 | $1,471 | $118,759 | $19,250 | $99,509 |
| 2018 | $103 | $89,971 | $19,250 | $70,721 |
| 2017 | $1,258 | $163,584 | $19,250 | $128,584 |
| 2016 | $144 | $86,604 | $19,250 | $67,354 |
| 2015 | $113 | $80,480 | $19,250 | $61,230 |
| 2014 | $113 | $77,565 | $19,250 | $58,315 |
| 2013 | -- | $77,565 | $19,206 | $58,359 |
Source: Public Records
Map
Nearby Homes
Your Personal Tour Guide
Ask me questions while you tour the home.