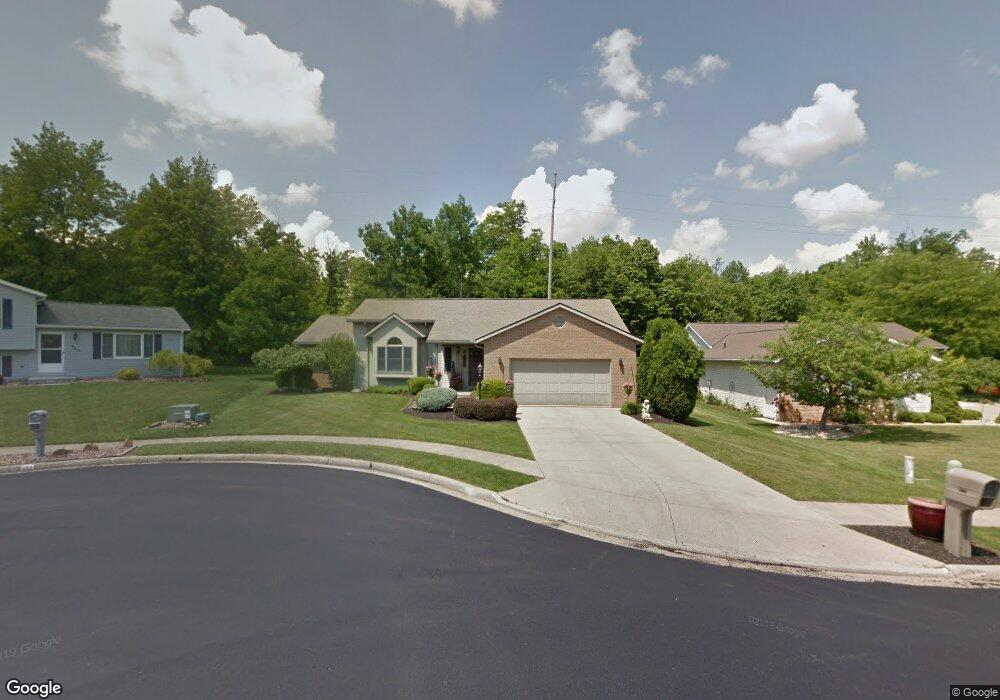
936 W Linden Cir Mansfield, OH 44906
Estimated Value: $210,000 - $259,000
3
Beds
2
Baths
1,794
Sq Ft
$131/Sq Ft
Est. Value
About This Home
This home is located at 936 W Linden Cir, Mansfield, OH 44906 and is currently estimated at $235,204, approximately $131 per square foot. 936 W Linden Cir is a home located in Richland County with nearby schools including Mansfield Elective Academy, Goal Digital Academy, and Interactive Media & Construction (IMAC) Academy.
Ownership History
Date
Name
Owned For
Owner Type
Purchase Details
Closed on
May 30, 2008
Sold by
Schemine Nick A and Schemine Hilda N
Bought by
Lyons Rebecca L
Current Estimated Value
Home Financials for this Owner
Home Financials are based on the most recent Mortgage that was taken out on this home.
Original Mortgage
$143,419
Outstanding Balance
$91,465
Interest Rate
5.93%
Mortgage Type
FHA
Estimated Equity
$143,739
Purchase Details
Closed on
Jul 26, 1995
Sold by
Smith Raymond J
Bought by
Schemine Nick A and Schemine Hilda N
Purchase Details
Closed on
Sep 22, 1994
Sold by
Zimmerman Benjamin J
Bought by
Smith Raymond J and Smith Janice Y
Home Financials for this Owner
Home Financials are based on the most recent Mortgage that was taken out on this home.
Original Mortgage
$95,000
Interest Rate
5.6%
Mortgage Type
New Conventional
Create a Home Valuation Report for This Property
The Home Valuation Report is an in-depth analysis detailing your home's value as well as a comparison with similar homes in the area
Home Values in the Area
Average Home Value in this Area
Purchase History
| Date | Buyer | Sale Price | Title Company |
|---|---|---|---|
| Lyons Rebecca L | $157,000 | Southern Title | |
| Schemine Nick A | $136,500 | -- | |
| Smith Raymond J | $15,000 | -- |
Source: Public Records
Mortgage History
| Date | Status | Borrower | Loan Amount |
|---|---|---|---|
| Open | Lyons Rebecca L | $143,419 | |
| Previous Owner | Smith Raymond J | $95,000 | |
| Closed | Schemine Nick A | $0 |
Source: Public Records
Tax History Compared to Growth
Tax History
| Year | Tax Paid | Tax Assessment Tax Assessment Total Assessment is a certain percentage of the fair market value that is determined by local assessors to be the total taxable value of land and additions on the property. | Land | Improvement |
|---|---|---|---|---|
| 2024 | $2,925 | $62,460 | $7,190 | $55,270 |
| 2023 | $2,925 | $62,460 | $7,190 | $55,270 |
| 2022 | $2,671 | $47,800 | $6,160 | $41,640 |
| 2021 | $2,689 | $47,800 | $6,160 | $41,640 |
| 2020 | $2,750 | $47,800 | $6,160 | $41,640 |
| 2019 | $3,048 | $47,800 | $6,160 | $41,640 |
| 2018 | $3,006 | $47,800 | $6,160 | $41,640 |
| 2017 | $3,031 | $47,800 | $6,160 | $41,640 |
| 2016 | $3,136 | $49,700 | $6,620 | $43,080 |
| 2015 | $3,136 | $49,700 | $6,620 | $43,080 |
| 2014 | $2,957 | $49,700 | $6,620 | $43,080 |
| 2012 | $1,186 | $52,320 | $6,970 | $45,350 |
Source: Public Records
Map
Nearby Homes
- 244 S Trimble Rd Unit 246
- 232 S Trimble Rd Unit 234
- 216 S Trimble Rd Unit 218
- 1068 Linwood Place
- 408 Fairlawn Ave
- 191 Fairlawn Ave
- 142 Grasmere Ave
- 143 Fairlawn Ave
- 135 Fairlawn Ave
- 129 Fairlawn Ave
- 679 Coleman Rd
- 0 Old Mill Run Rd Unit 9067543
- 0 Old Mill Run Rd Unit 9067542
- 37 S Linden Rd
- 1157 Deer Run Rd
- 118 Parkwood Blvd
- 616 Cline Ave
- 0 Bally Row Unit Lot 22930 223011207
- 0 Bally Row Unit Lot 22929 223011206
- 0 Bally Row Unit Lot 22940 223011208
- 930 W Linden Cir
- 942 W Linden Cir
- 924 W Linden Cir
- 948 W Linden Cir
- 923 W Linden Cir
- 918 W Linden Cir
- 954 W Linden Cir
- 929 W Linden Cir
- 960 W Linden Cir
- 912 W Linden Cir
- 917 W Linden Cir
- 311 S Trimble Rd
- 943 Linwood Place
- 953 Linwood Place
- 935 W Linden Cir
- 966 W Linden Cir
- 959 Linwood Place
- 290 S Linden Rd
- 906 W Linden Cir
- 921 Linwood Place