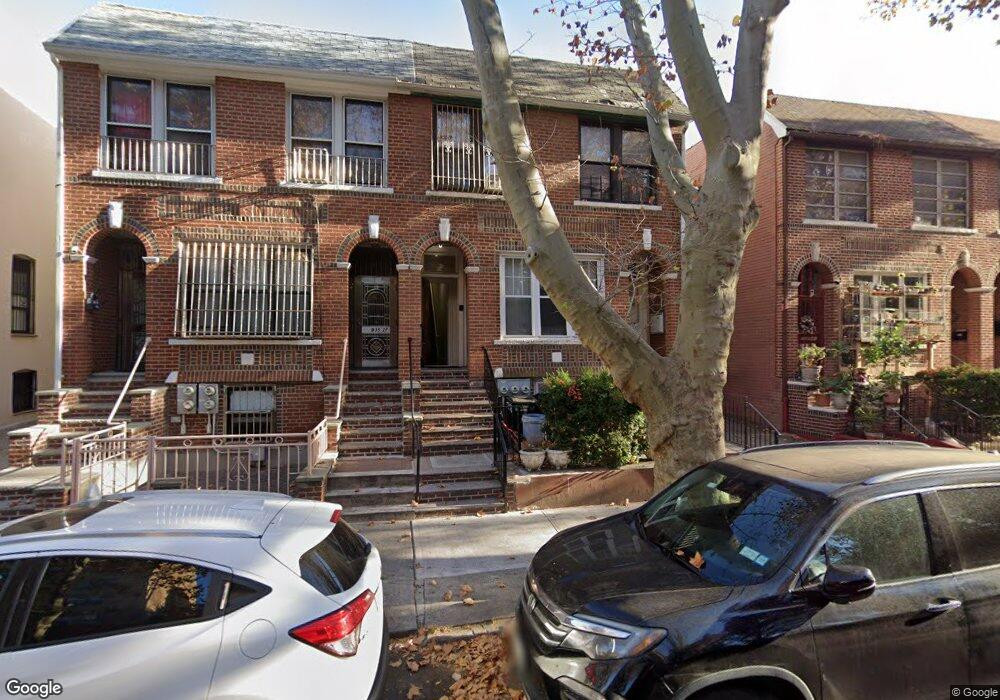
937 53rd St Brooklyn, NY 11219
Borough Park NeighborhoodEstimated Value: $1,608,000 - $2,136,823
Studio
--
Bath
2,640
Sq Ft
$683/Sq Ft
Est. Value
About This Home
This home is located at 937 53rd St, Brooklyn, NY 11219 and is currently estimated at $1,804,206, approximately $683 per square foot. 937 53rd St is a home located in Kings County with nearby schools including P.S. 160 William T Sampson School, IS 220 John J. Pershing, and Franklin Delano Roosevelt High School.
Ownership History
Date
Name
Owned For
Owner Type
Purchase Details
Closed on
Mar 3, 2003
Sold by
Teitelbaum Aryeh Leibish
Bought by
Batim Llc
Current Estimated Value
Purchase Details
Closed on
Oct 24, 1996
Sold by
Ventrice Marguerita
Bought by
Teitelbaum Aryeh
Home Financials for this Owner
Home Financials are based on the most recent Mortgage that was taken out on this home.
Original Mortgage
$150,000
Outstanding Balance
$12,449
Interest Rate
7.82%
Estimated Equity
$1,791,757
Create a Home Valuation Report for This Property
The Home Valuation Report is an in-depth analysis detailing your home's value as well as a comparison with similar homes in the area
Home Values in the Area
Average Home Value in this Area
Purchase History
| Date | Buyer | Sale Price | Title Company |
|---|---|---|---|
| Batim Llc | -- | -- | |
| Batim Llc | -- | -- | |
| Teitelbaum Aryeh | $266,500 | -- | |
| Teitelbaum Aryeh | $266,500 | -- |
Source: Public Records
Mortgage History
| Date | Status | Borrower | Loan Amount |
|---|---|---|---|
| Open | Teitelbaum Aryeh | $150,000 | |
| Closed | Teitelbaum Aryeh | $150,000 |
Source: Public Records
Tax History
| Year | Tax Paid | Tax Assessment Tax Assessment Total Assessment is a certain percentage of the fair market value that is determined by local assessors to be the total taxable value of land and additions on the property. | Land | Improvement |
|---|---|---|---|---|
| 2025 | $11,140 | $120,180 | $31,140 | $89,040 |
| 2024 | $11,140 | $95,880 | $31,140 | $64,740 |
| 2023 | $11,264 | $117,240 | $31,140 | $86,100 |
| 2022 | $10,471 | $113,220 | $31,140 | $82,080 |
| 2021 | $10,923 | $99,360 | $31,140 | $68,220 |
| 2020 | $5,123 | $89,040 | $31,140 | $57,900 |
| 2019 | $9,669 | $89,040 | $31,140 | $57,900 |
| 2018 | $9,422 | $46,220 | $16,498 | $29,722 |
| 2017 | $8,911 | $43,712 | $14,358 | $29,354 |
| 2016 | $8,647 | $43,254 | $18,692 | $24,562 |
| 2015 | $4,974 | $40,807 | $21,347 | $19,460 |
| 2014 | $4,974 | $38,517 | $18,261 | $20,256 |
Source: Public Records
Map
Nearby Homes
Your Personal Tour Guide
Ask me questions while you tour the home.