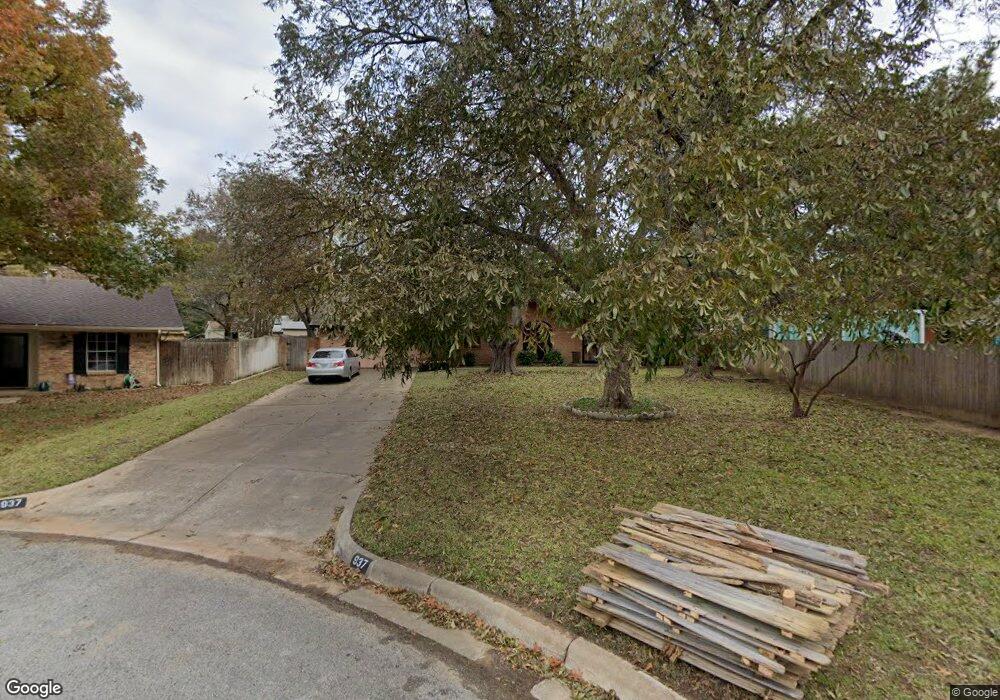
937 Charleston Ct Bedford, TX 76022
Estimated Value: $317,000 - $390,000
3
Beds
2
Baths
1,835
Sq Ft
$191/Sq Ft
Est. Value
About This Home
This home is located at 937 Charleston Ct, Bedford, TX 76022 and is currently estimated at $351,070, approximately $191 per square foot. 937 Charleston Ct is a home located in Tarrant County with nearby schools including Bell Manor Elementary School, Central J High School, and Trinity High School.
Ownership History
Date
Name
Owned For
Owner Type
Purchase Details
Closed on
Dec 28, 2024
Sold by
Thompson Laurie and Davison Family Irrevocable Trust
Bought by
Laurie Davison Thompson Trust and Thompson
Current Estimated Value
Purchase Details
Closed on
May 19, 1998
Sold by
Jordan Daniel L and Jordan Patricia A
Bought by
Davison Claude W and Davison Jacqueline L
Home Financials for this Owner
Home Financials are based on the most recent Mortgage that was taken out on this home.
Original Mortgage
$69,900
Interest Rate
7.22%
Purchase Details
Closed on
Aug 23, 1993
Sold by
Rice Cornelius M and Rice Birgit A
Bought by
Jordan Daniel L and Jordan Patricia A
Home Financials for this Owner
Home Financials are based on the most recent Mortgage that was taken out on this home.
Original Mortgage
$78,074
Interest Rate
7.18%
Mortgage Type
FHA
Create a Home Valuation Report for This Property
The Home Valuation Report is an in-depth analysis detailing your home's value as well as a comparison with similar homes in the area
Home Values in the Area
Average Home Value in this Area
Purchase History
| Date | Buyer | Sale Price | Title Company |
|---|---|---|---|
| Laurie Davison Thompson Trust | -- | None Listed On Document | |
| Davison Claude W | -- | First American Title Co | |
| Jordan Daniel L | -- | Stewart Title North Texas |
Source: Public Records
Mortgage History
| Date | Status | Borrower | Loan Amount |
|---|---|---|---|
| Previous Owner | Davison Claude W | $69,900 | |
| Previous Owner | Jordan Daniel L | $78,074 |
Source: Public Records
Tax History Compared to Growth
Tax History
| Year | Tax Paid | Tax Assessment Tax Assessment Total Assessment is a certain percentage of the fair market value that is determined by local assessors to be the total taxable value of land and additions on the property. | Land | Improvement |
|---|---|---|---|---|
| 2025 | $1,096 | $298,217 | $55,000 | $243,217 |
| 2024 | $1,096 | $298,217 | $55,000 | $243,217 |
| 2023 | $7,716 | $337,235 | $55,000 | $282,235 |
| 2022 | $6,164 | $257,666 | $40,000 | $217,666 |
| 2021 | $5,968 | $216,288 | $40,000 | $176,288 |
| 2020 | $5,480 | $217,644 | $40,000 | $177,644 |
| 2019 | $5,226 | $202,602 | $40,000 | $162,602 |
| 2018 | $1,470 | $163,314 | $35,000 | $128,314 |
| 2017 | $4,456 | $168,200 | $35,000 | $133,200 |
| 2016 | $4,050 | $155,295 | $25,000 | $130,295 |
| 2015 | $1,528 | $122,700 | $18,000 | $104,700 |
| 2014 | $1,528 | $122,700 | $18,000 | $104,700 |
Source: Public Records
Map
Nearby Homes
- 952 Charleston Dr
- 933 Charleston Ct
- 1613 Trinity Ct
- 804 Natchez Ave
- 1604 Richmond Dr
- 2024 Charleston Dr
- 2101 Gettysburg Place
- 1701 Winchester Way
- 828 Gregory Ave
- 2025 Schumac Ln
- 2201 Greendale Ct
- 808 Gregory Ave
- 1213 Greendale Dr
- 1049 Stableway Ln
- 1031 Boston Blvd
- 904 Nelson Terrace
- 800 Prestwick St
- 1116 Highpoint Rd
- 1216 Princeton Place
- 1004 Overhill Dr
- 941 Charleston Dr
- 945 Charleston Dr
- 1808 Chattanooga Dr
- 1804 Chattanooga Dr
- 949 Charleston Dr
- 1812 Chattanooga Dr
- 929 Charleston Ct
- 1800 Chattanooga Dr
- 953 Charleston Dr
- 917 Charleston Ct
- 925 Charleston Ct
- 936 Chattanooga Dr
- 921 Charleston Ct
- 944 Charleston Dr
- 940 Charleston Dr
- 948 Charleston Dr
- 932 Chattanooga Dr
- 957 Charleston Dr
- 1820 Chattanooga Dr
- 920 Charleston Dr