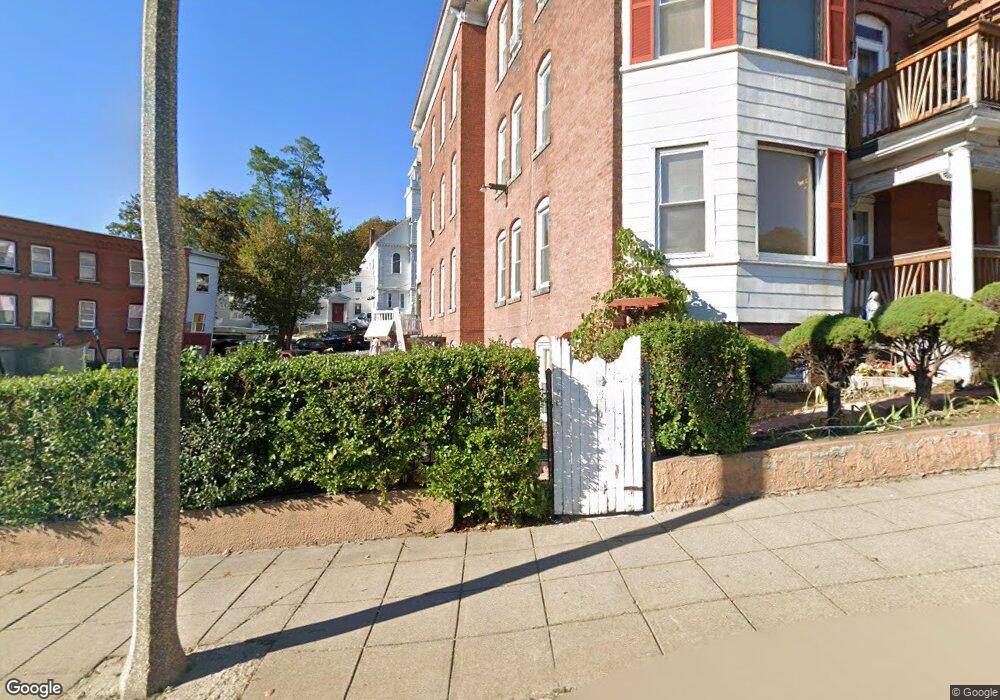
937 Main St Unit 943 Fitchburg, MA 01420
Estimated Value: $419,427 - $677,000
6
Beds
3
Baths
5,825
Sq Ft
$94/Sq Ft
Est. Value
About This Home
This home is located at 937 Main St Unit 943, Fitchburg, MA 01420 and is currently estimated at $545,107, approximately $93 per square foot. 937 Main St Unit 943 is a home located in Worcester County with nearby schools including Crocker Elementary School, South Street Elementary School, and Reingold Elementary School.
Ownership History
Date
Name
Owned For
Owner Type
Purchase Details
Closed on
Apr 6, 2001
Sold by
Romano John Anthony
Bought by
Leon Julio Cesar
Current Estimated Value
Home Financials for this Owner
Home Financials are based on the most recent Mortgage that was taken out on this home.
Original Mortgage
$139,750
Outstanding Balance
$51,632
Interest Rate
7.05%
Mortgage Type
Purchase Money Mortgage
Estimated Equity
$493,475
Create a Home Valuation Report for This Property
The Home Valuation Report is an in-depth analysis detailing your home's value as well as a comparison with similar homes in the area
Home Values in the Area
Average Home Value in this Area
Purchase History
| Date | Buyer | Sale Price | Title Company |
|---|---|---|---|
| Leon Julio Cesar | $142,000 | -- |
Source: Public Records
Mortgage History
| Date | Status | Borrower | Loan Amount |
|---|---|---|---|
| Open | Leon Julio Cesar | $48,500 | |
| Open | Leon Julio Cesar | $139,750 | |
| Previous Owner | Leon Julio Cesar | $15,000 |
Source: Public Records
Tax History Compared to Growth
Tax History
| Year | Tax Paid | Tax Assessment Tax Assessment Total Assessment is a certain percentage of the fair market value that is determined by local assessors to be the total taxable value of land and additions on the property. | Land | Improvement |
|---|---|---|---|---|
| 2025 | $69 | $511,800 | $83,500 | $428,300 |
| 2024 | $6,476 | $437,300 | $55,200 | $382,100 |
| 2023 | $6,272 | $391,500 | $39,600 | $351,900 |
| 2022 | $5,829 | $331,000 | $34,800 | $296,200 |
| 2021 | $4,944 | $259,800 | $26,400 | $233,400 |
| 2020 | $4,535 | $230,100 | $21,600 | $208,500 |
| 2019 | $3,256 | $158,900 | $30,000 | $128,900 |
| 2018 | $2,935 | $139,700 | $27,600 | $112,100 |
| 2017 | $2,789 | $129,800 | $25,200 | $104,600 |
| 2016 | $2,794 | $131,600 | $25,200 | $106,400 |
| 2015 | $2,877 | $139,100 | $26,400 | $112,700 |
| 2014 | $2,810 | $141,700 | $26,400 | $115,300 |
Source: Public Records
Map
Nearby Homes
- 10 Prospect St
- 50 Prospect St
- 13-15 Chestnut St
- 90 Mechanic St
- 39 Arlington St
- 47 Arlington St
- 59 Arlington St
- 58 Arlington St Unit 60
- 33-35 Omena Place
- 62 Grove St
- 154 Pleasant St
- 21-23 Omena Place
- 21 Haskell St
- 68 Marshall St
- 376 Elm St
- 230 Kimball St
- 332 Kimball St
- 202 High St
- 205-207 High St
- 58 Oliver St
- 933 Main St
- 958-960 Main St
- 956 Main St
- 1 Prospect St
- 13 Prospect St
- 3 Prospect St
- 24 Caldwell Place
- 2 Caldwell Place
- 938 Main St
- 5 Prospect St
- 18 Mechanic St
- 18 Mechanic St
- 18 Mechanic St Unit SF
- 16 Prospect St
- 924 Main St
- 924 Main St Unit 3
- 24 Mechanic St
- 914 Main St Unit 3
- 912 Main St Unit 2nd floor
- 912 Main St Unit 1